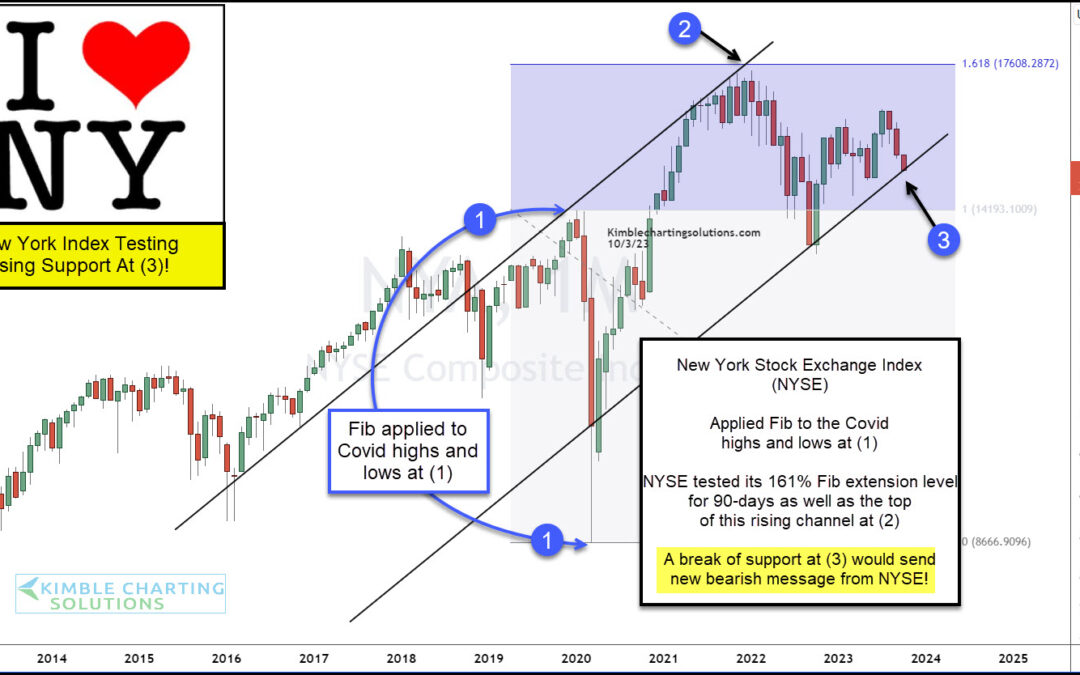
by Chris Kimble | Oct 6, 2023 | Kimble Charting
With stocks under pressure, it is time to take a look at a key stock market index that also serves as a barometer of market strength (with more than 3500 stocks). Today, we turn our attention to the New York Stock Exchange Composite Index (NYSE) with a long-term...
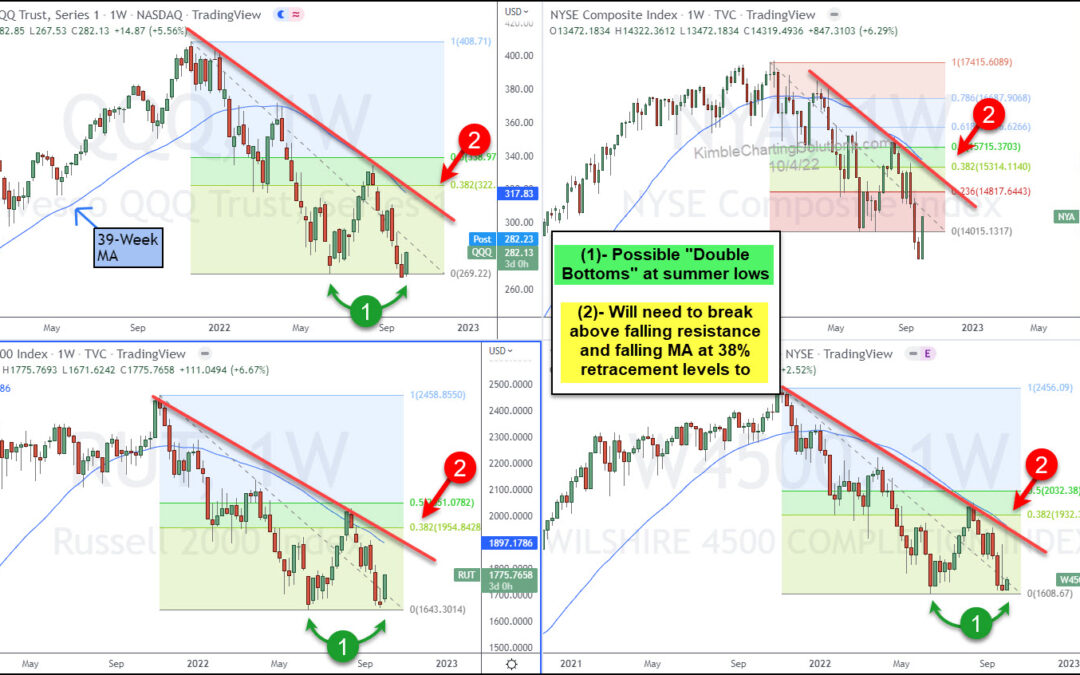
by Chris Kimble | Oct 6, 2022 | Kimble Charting
With stock markets in deep declines, traders need to stay cautious and adhere to their plans. As the same time, it is smart to identify potential technical patterns and what if scenarios to help identify potential trend changes. Today, we look at a chart 4-pack to...
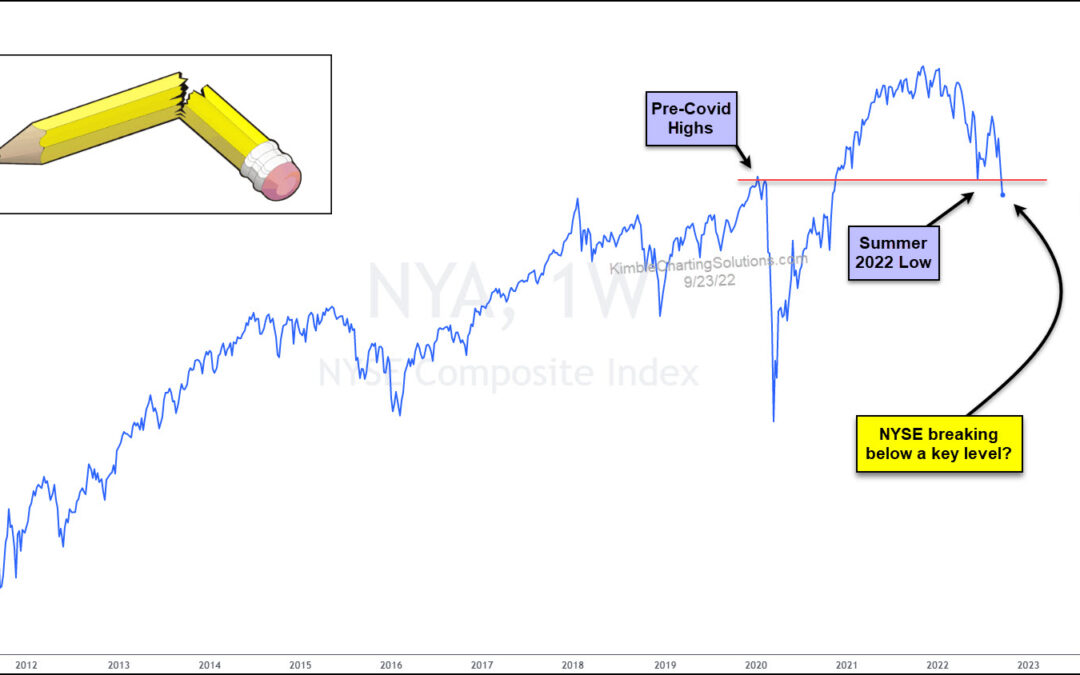
by Chris Kimble | Sep 26, 2022 | Kimble Charting
The broader stock market has been ravished this year, with several global indices falling into bear markets. And there may be more pain ahead. Today we look at a 10+ year chart of the NYSE Composite. This index is broad-based and an excellent gauge of market health....
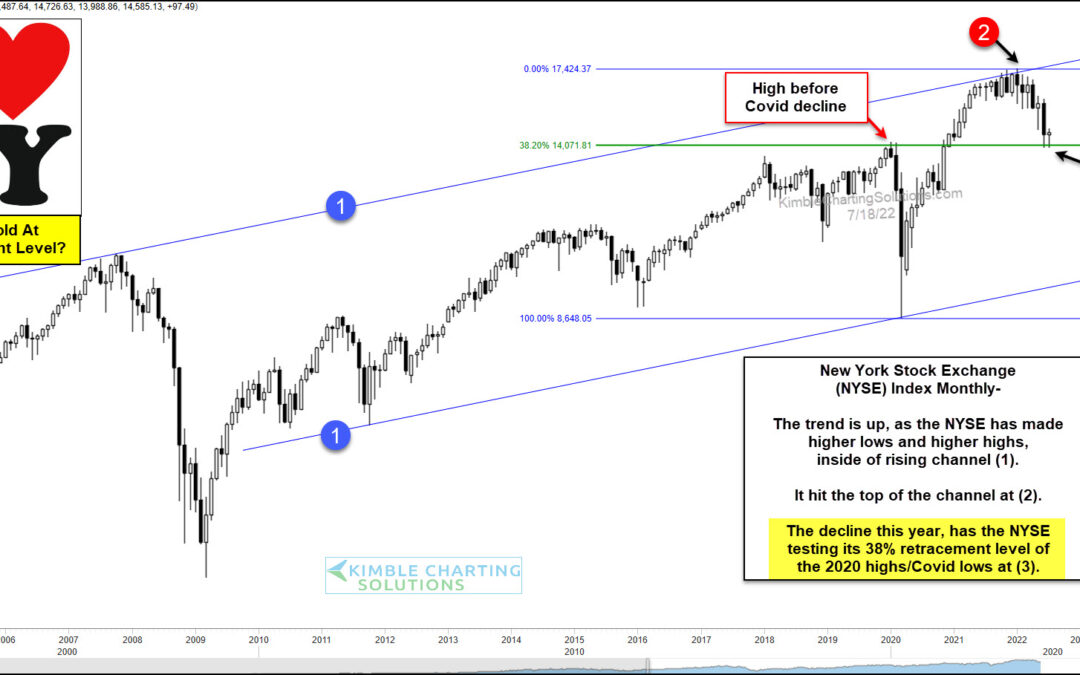
by Chris Kimble | Jul 20, 2022 | Kimble Charting
It’s been a volatile couple of weeks for the stock market. And big moves have shaken out weak hands and created a day traders paradise… or demise. Could all this volatility be a precursor to a trading low? Is the market ready for a bounce? Today we look at a very...
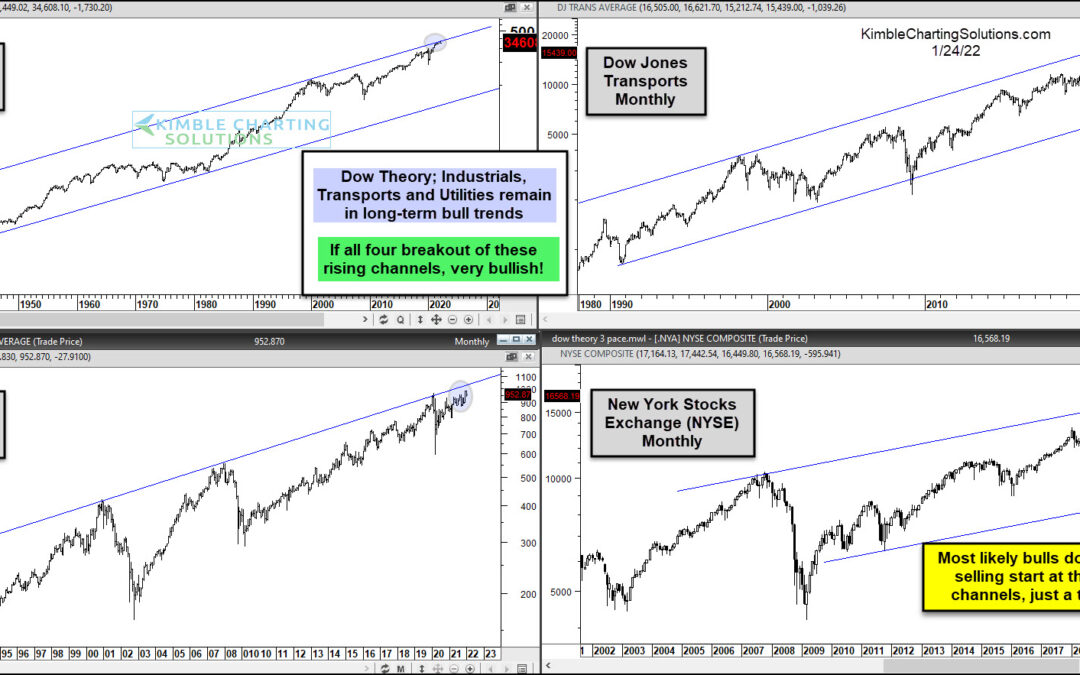
by Chris Kimble | Jan 24, 2022 | Kimble Charting
Today’s chart 4-pack illustrates why the broader stock market has reached a critical juncture this month. Investors are feeling the heat from recent selling. Why? Well, as the “monthly” charts above show, the Dow Industrials, Dow Transports, Dow Utilities, and NYSE...
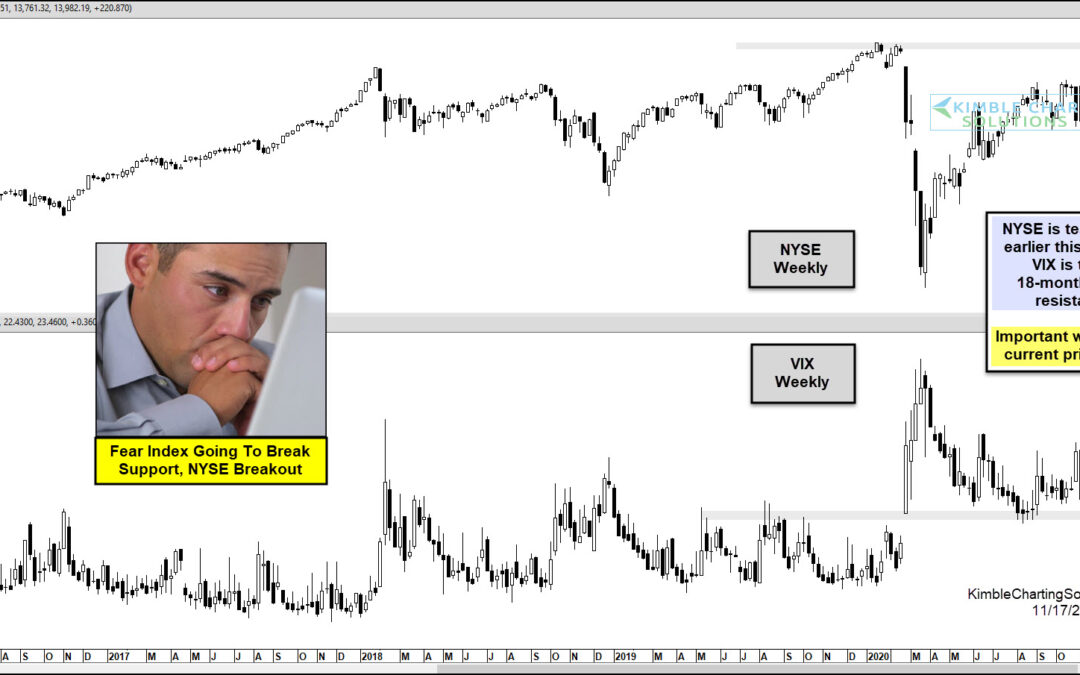
by Chris Kimble | Nov 17, 2020 | Kimble Charting
Is a key broad market index about to breakout? YES! With the trend being up for the NYSE index, a key breakout test is in play in the top half of the chart above. At the same time, the fear index (VIX) is testing a support & resistance line, that has been in play...
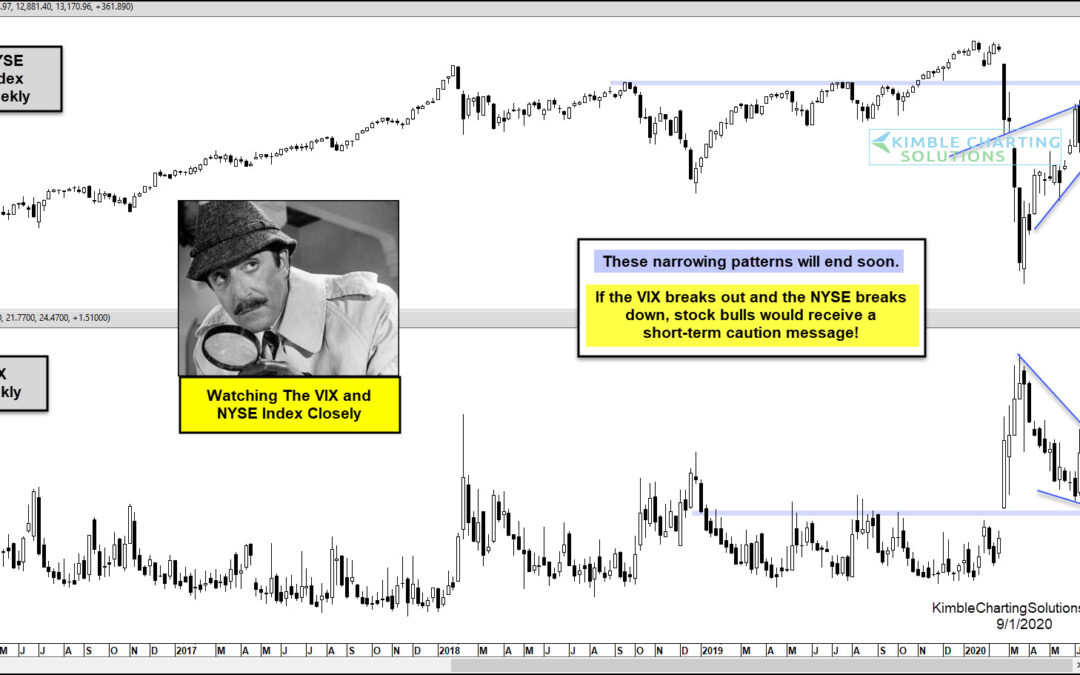
by Chris Kimble | Sep 2, 2020 | Kimble Charting
Investors have been fixated on the Nasdaq and tech stocks this year. And rightfully so. The Nasdaq has been the market leader, with stocks like Apple, Tesla, Facebook, and Amazon flying higher. But another important index may be flashing caution: The NYSE...
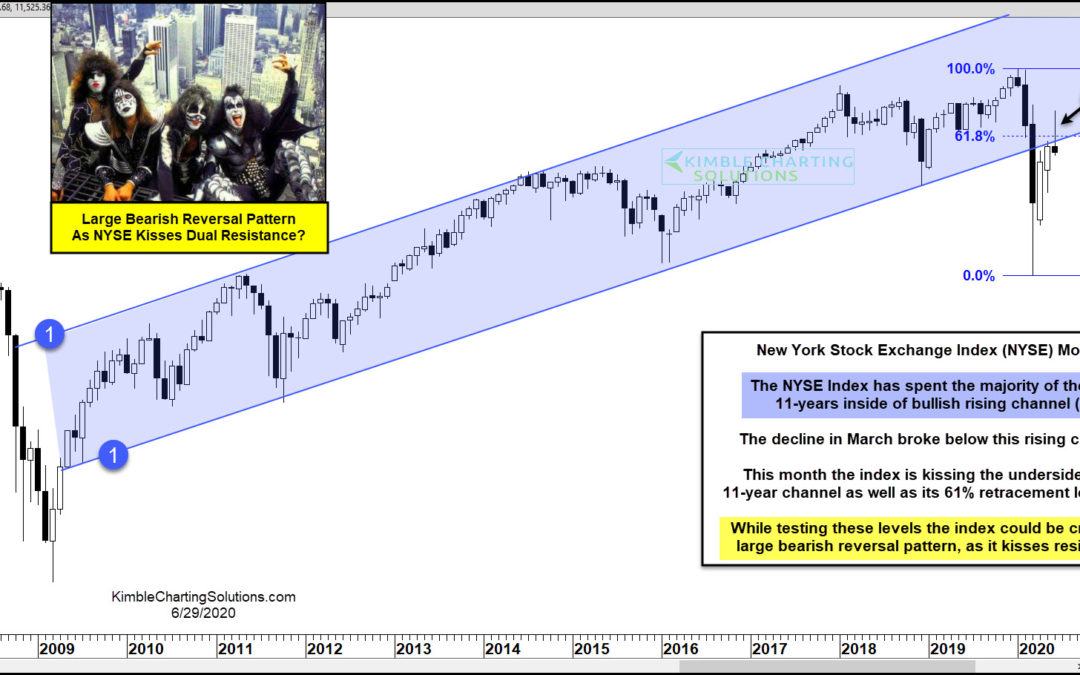
by Chris Kimble | Jun 29, 2020 | Kimble Charting
Is the New York Stock Exchange Index (NYSE) sending one of the largest bearish messages in years? Possible! This chart looks at the NYSE index on a monthly basis over the past 13-years. The index spent the majority of the past 11-years inside of rising channel (1)....
