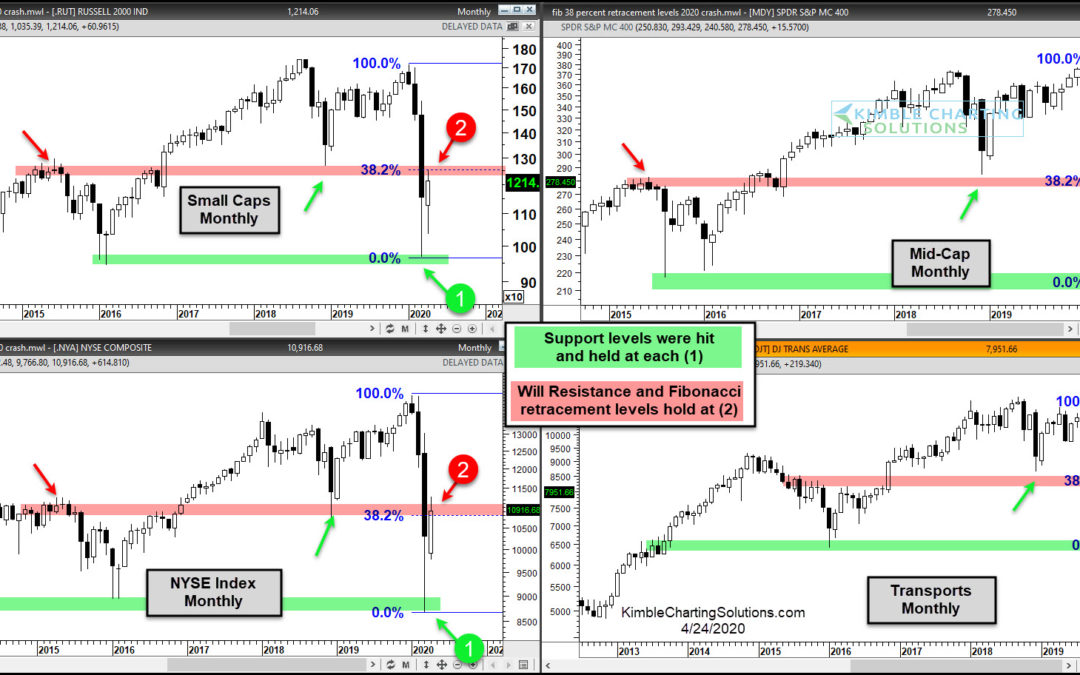
by Chris Kimble | Apr 24, 2020 | Kimble Charting
The bullish case for stocks is being put to an important price test here and now! This 4-pack reflects that “new resistance” and Fibonacci retracement levels are in play for each of these look-alike patterns. Each of these important indices hit long-term...
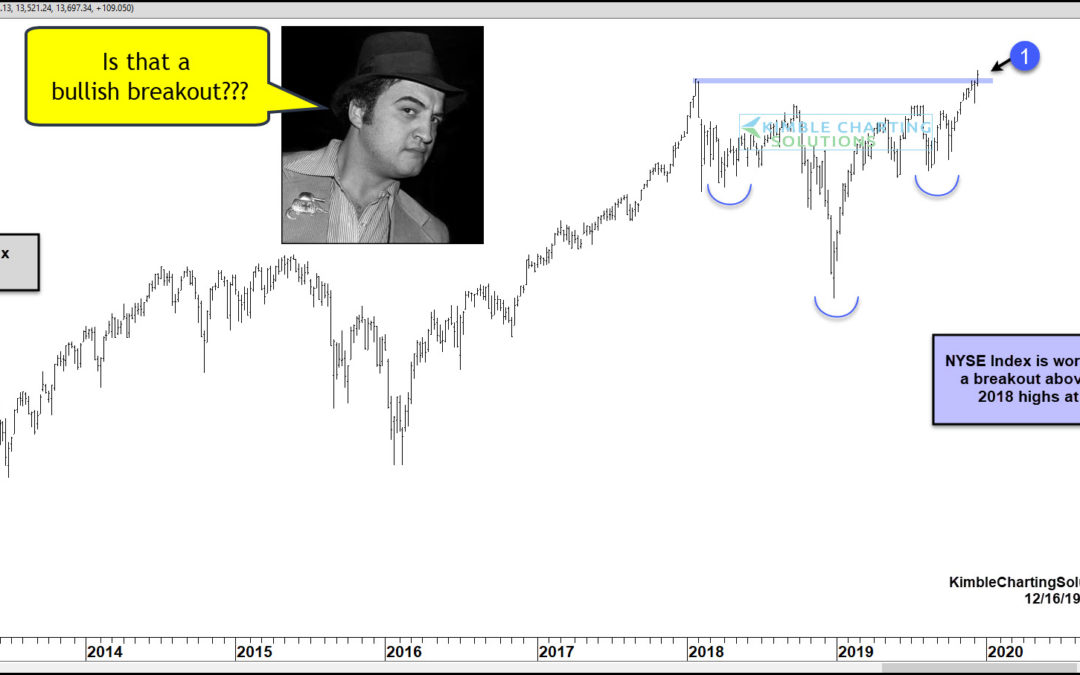
by Chris Kimble | Dec 16, 2019 | Kimble Charting
The New York Stock Exchange hasn’t had much to brag about for the past 2-years! Are things about to change for this broad-based index? What happens at (1), looks to be very important for this index and the S&P 500 as well. This chart looks at the NYSE index...
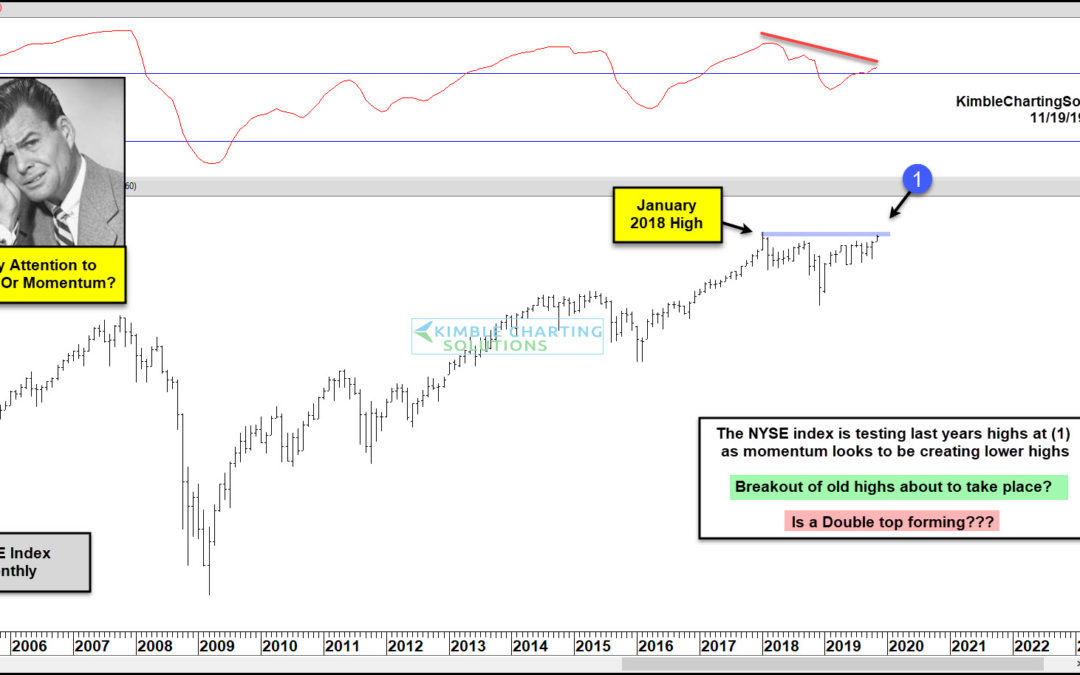
by Chris Kimble | Nov 19, 2019 | Kimble Charting
A very broad index is testing last year’s highs, as monthly momentum is creating lower highs? Which indicator is more important, price or momentum? This chart looks at the New York Stock Exchange Index (NYSE) on a monthly basis over the past 15-years. The index...
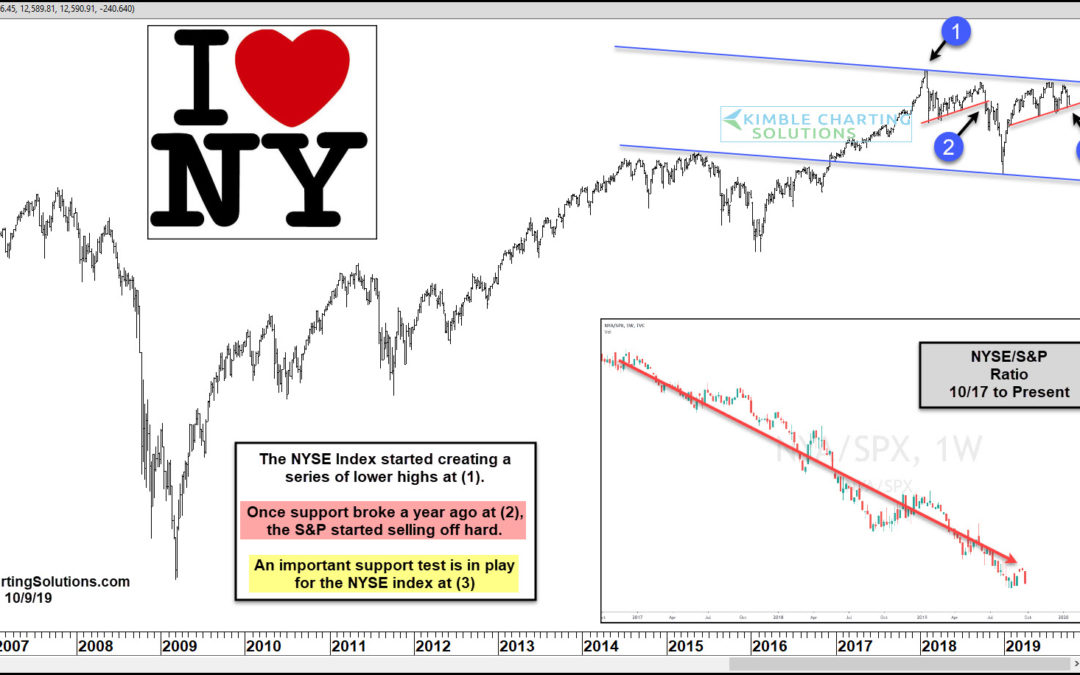
by Chris Kimble | Oct 9, 2019 | Kimble Charting
Is the New York Stock Exchange Index (NYSE) about to send the S&P 500 a fresh bearish message? Possible! The NYSE index has been much weaker than the S&P 500 for the past couple of years (see lower right ratio chart). The NYSE index actually peaked in January...
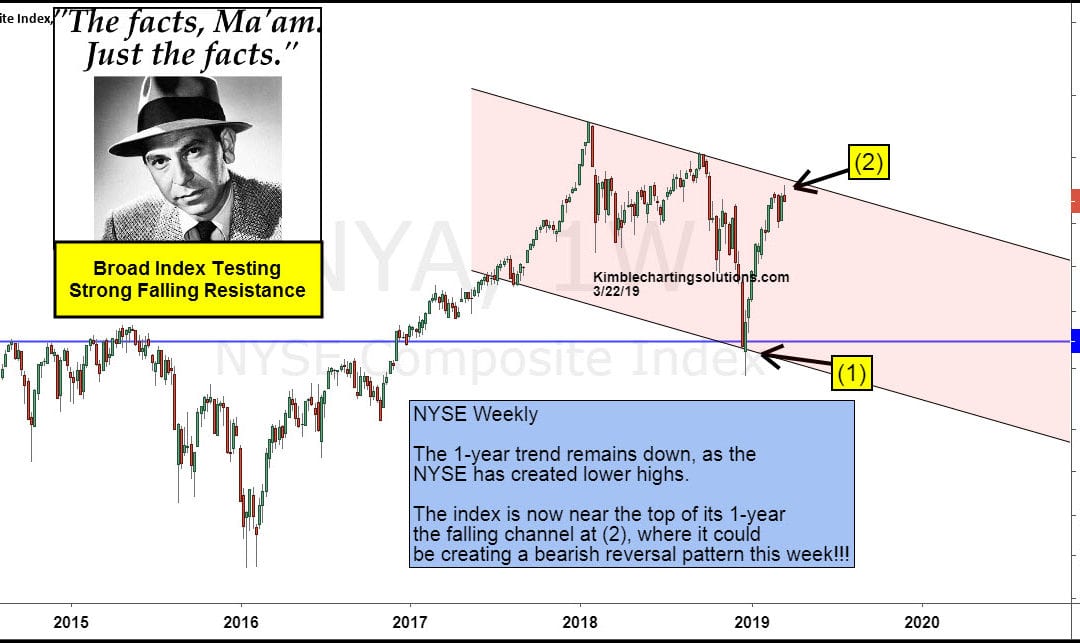
by Chris Kimble | Mar 22, 2019 | Kimble Charting
Is a very broad stock index suggesting that a top is in play? What this index does to close this week should go a long way to answering that question! This chart looks at the NYSE Index on a weekly basis over the past 4-years. Over the past 15-months, it has created a...
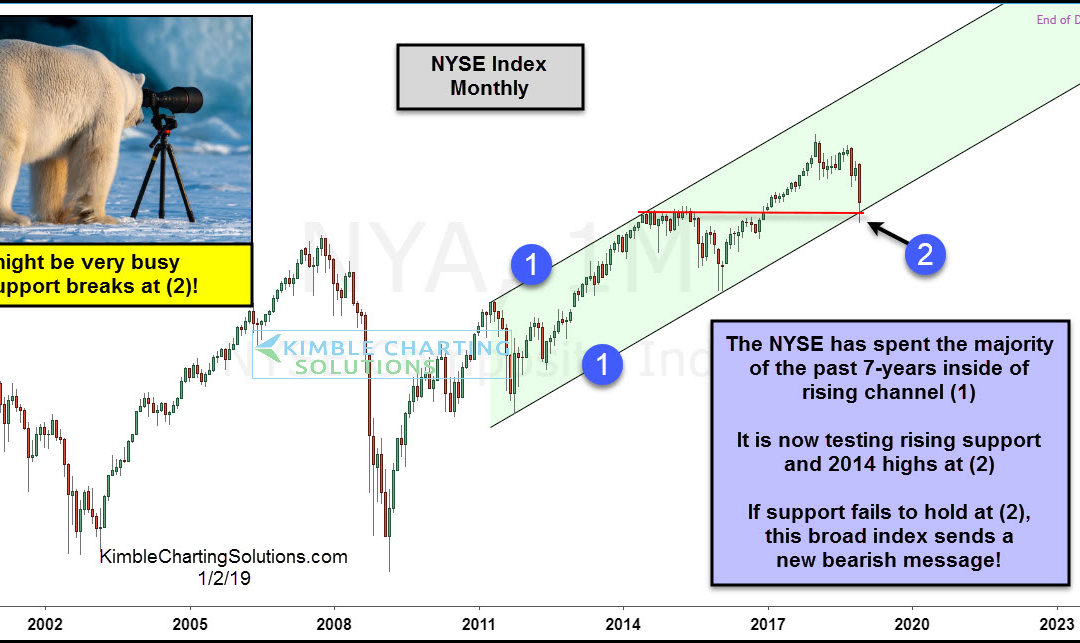
by Chris Kimble | Jan 2, 2019 | Kimble Charting
One of the broadest stock market indices in the states is starting off the year with a key test, that could send a very important message for months to come! This chart takes a look at the New York Stock Exchange index (NYSE) over the past 20-years. Since the 2011...
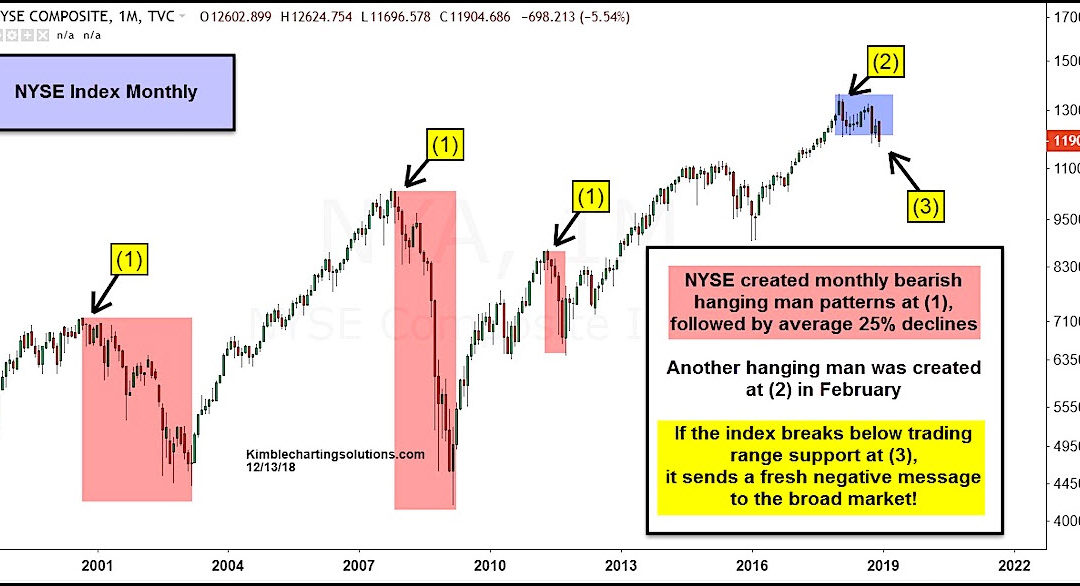
by Chris Kimble | Dec 17, 2018 | Kimble Charting
The NYSE Composite (NYA) is testing the bottom of its 12-month trading range this month. In fact, it’s breaking down and out of it… it’s sink or swim time. Will this be a quick undercut and reversal? Or the start of a deeper correction/bear market? Bulls need to...
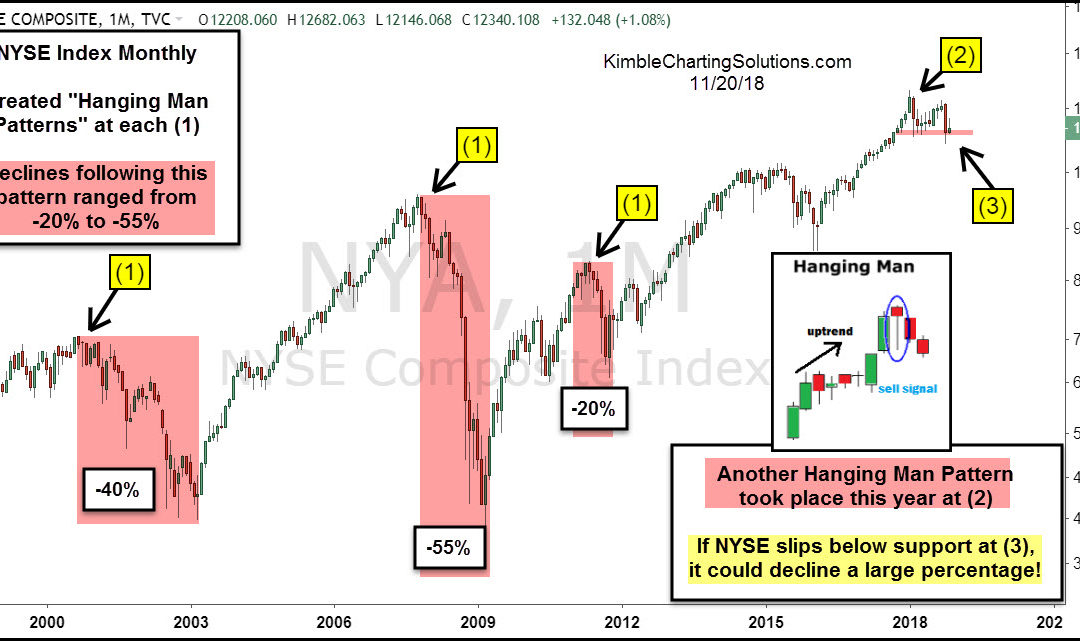
by Chris Kimble | Nov 20, 2018 | Kimble Charting
CLICK ON CHART TO ENLARGE This chart looks at the NYSE index over the past 20-years, highlighting “Hanging Man Patterns,” where they have taken place and what typically happens following this pattern. Monthly hanging man patterns took place near the highs...
