by Chris Kimble | Oct 31, 2018 | Kimble Charting
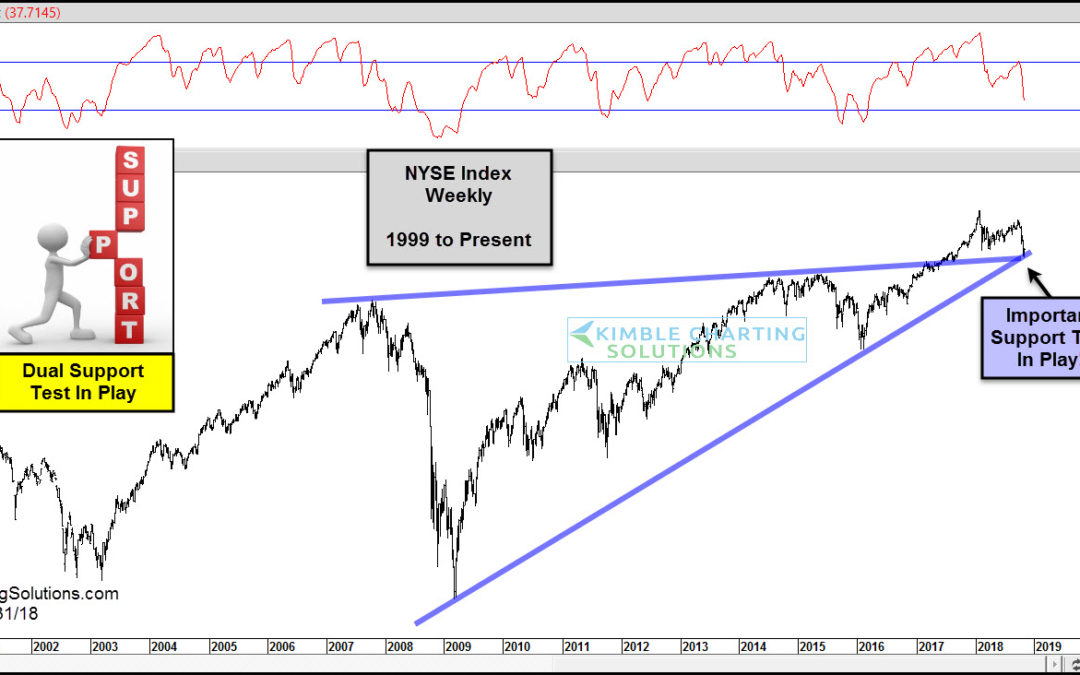
CLICK ON CHART TO ENLARGE This chart looks at the NYSE Index over the past 20-years on a weekly basis. This very broad index has traded sideways for the past 15-months, while the long-term trend remains up. Weakness this month finds the index testing dual long-term...
