877-721-7217 services@kimblechartingsolutions.com
  • Twitter
  • Twitter
  • Contact
  • Cart
0 Items
Kimble Charting Solutions
  • Blog Sign Up
  • Free Research (Blog)
  • Research Subscriptions
    • Most Popular Research
    • Premium Member Research
    • Weekly Research Reports
  • What We Do
    • What We Do For You
    • Charts Solve These Investing Challenges
    • What You Receive
  • About Us
    • About Us
    • Testimonials
    • Videos
    • As Seen On
  • Login
Select Page
Energy Stocks Exploring Multi-year pennant breakout

Energy Stocks Exploring Multi-year pennant breakout

by Chris Kimble | Apr 17, 2018 | Kimble Charting

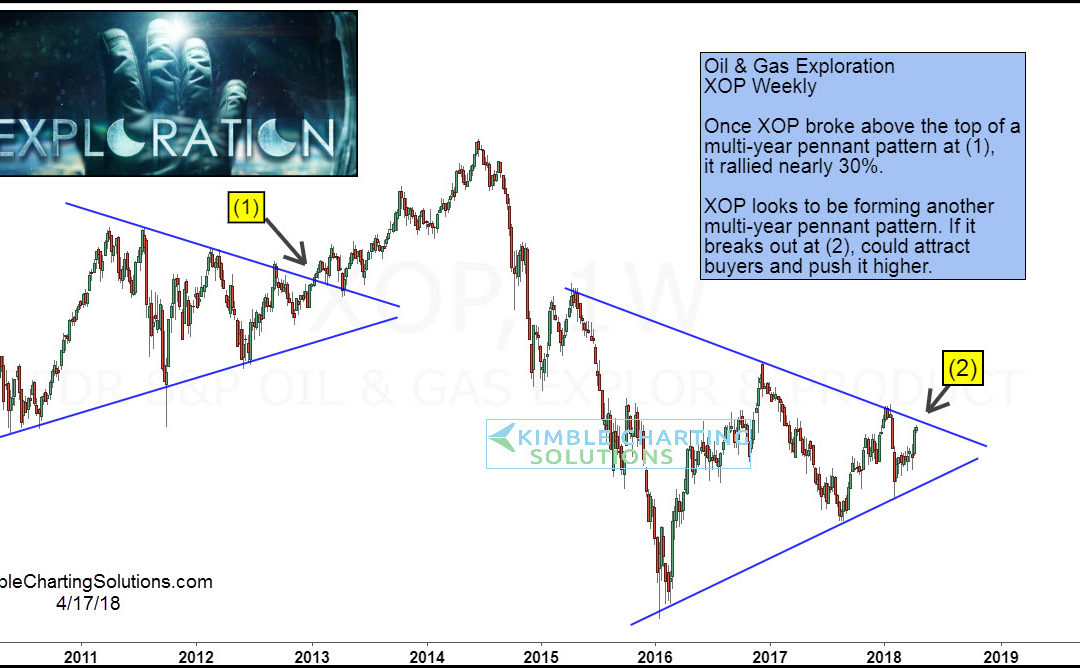
CLICK ON CHART TO ENLARGE The chart above looks at Oil & Gas Exploration EFT (XOP) over the past 8-years. From 2010 until 2013 it looks to have created a pennant pattern (series of higher lows and lower highs). Once resistance was taken out at (1), buyers came...
Oil & Gas Exploration stocks testing breakout level

Oil & Gas Exploration stocks testing breakout level

by Chris Kimble | Sep 20, 2017 | Kimble Charting

Oil & Gas Exploration stocks have been hit hard over the past few years, falling over 50%. Could an opportunity be at hand in this hard-hit sector? Possible! Below looks at the chart of Oil & Gas Exploration ETF (XOP) over the past few years. CLICK ON CHART TO...
Energy sector, jumping over neckline resistance!

Energy sector, jumping over neckline resistance!

by Chris Kimble | Dec 12, 2016 | Kimble Charting

Over the past couple of years, the Energy sector has declined a good deal more than it has rallied. Of late, some assets in the Energy sector, has been moving upward and have been jumping over key resistance levels! Crude Oil now following energy stocks, hopping over...

Topic Areas

10-year yield Apple Banks bonds China Commodities Copper CRB Index Crude Oil DAX Dollar Update Dow Jones Emerging Markets Euro GDX gdxj gld gold Gold Bugs Gold Stocks Govt. bonds High Yields Interest Rates Joe Friday Junk Bonds Kimble Charting Mid-Caps NASDAQ 100 ndx 100 Nikkei 225 NYSE Composite real estate Russell 2000 S&P S&P 500 Shanghai index silver slv SPX spy TLT US dollar What would you do? Wilshire 5000 Yields
  • Terms of Use
  • Contact
  • Twitter

Copyright ©2021 Kimble Charting Solutions. All Rights Reserved | Design by 16Wells