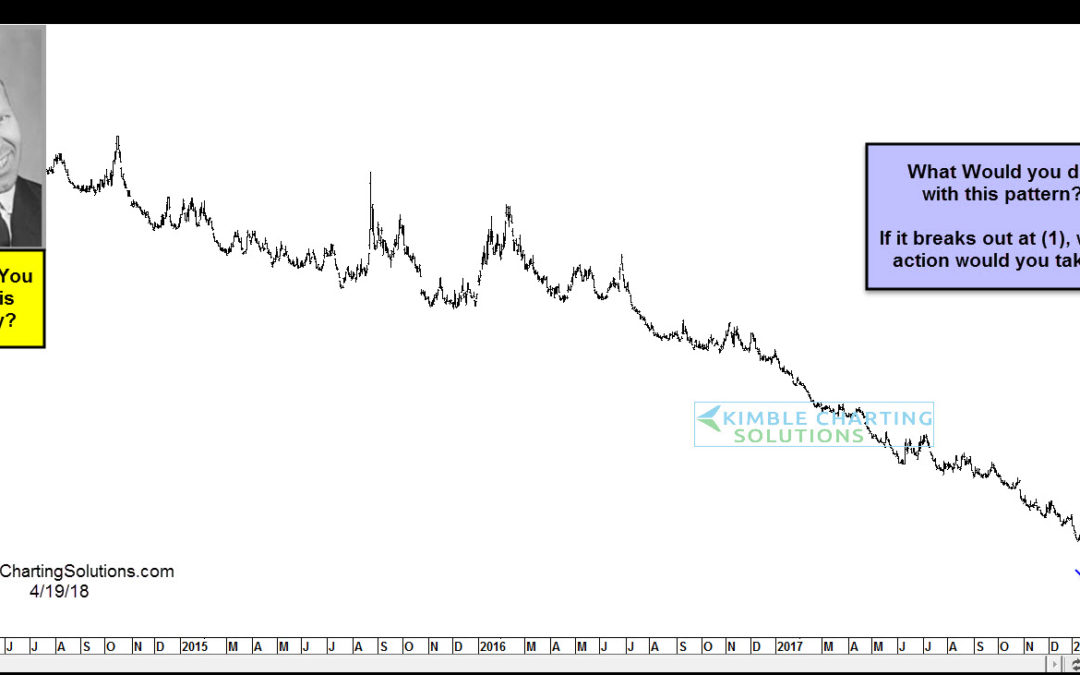
by Chris Kimble | Apr 19, 2018 | Kimble Charting
CLICK ON CHART TO ENLARGE This asset has done poorly for years and the trend for sure remains lower. Wondering what action you might take if it would breakout at (1)? If you would like to know what this asset is and what action we would take on a breakout at (1),...
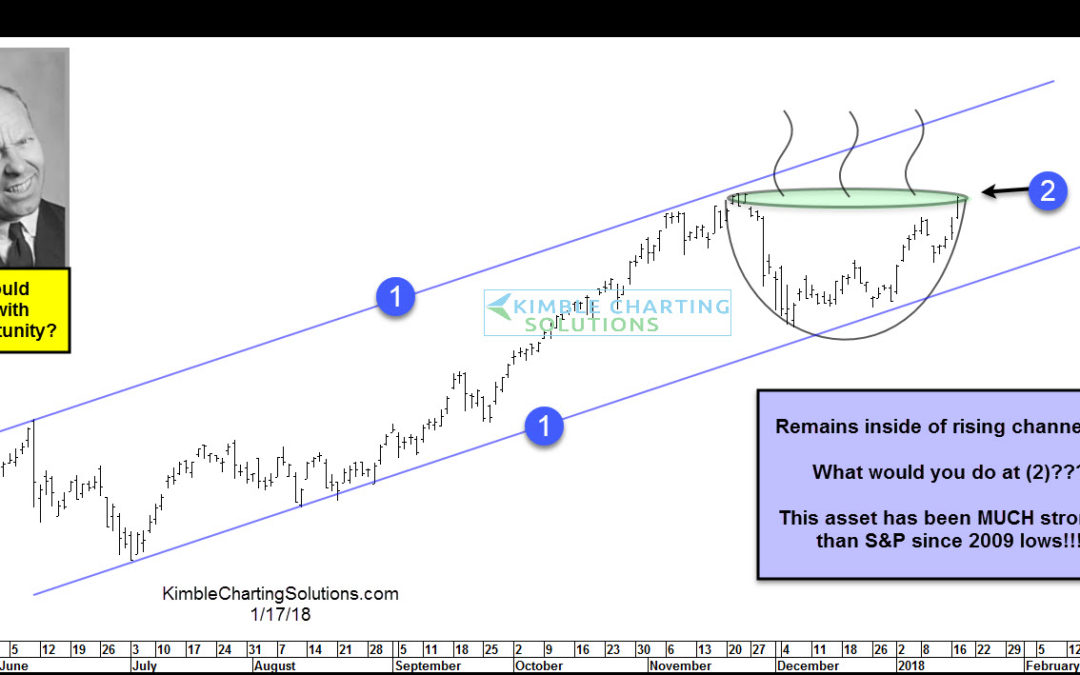
by Chris Kimble | Jan 17, 2018 | Kimble Charting
CLICK ON CHART TO ENLARGE This chart looks at an asset that remains inside of 8-month rising channel (1). It had been weak of late, where it tested rising support at the start of this year. This asset has “Doubled” the S&P 500 since the lows of 2009,...
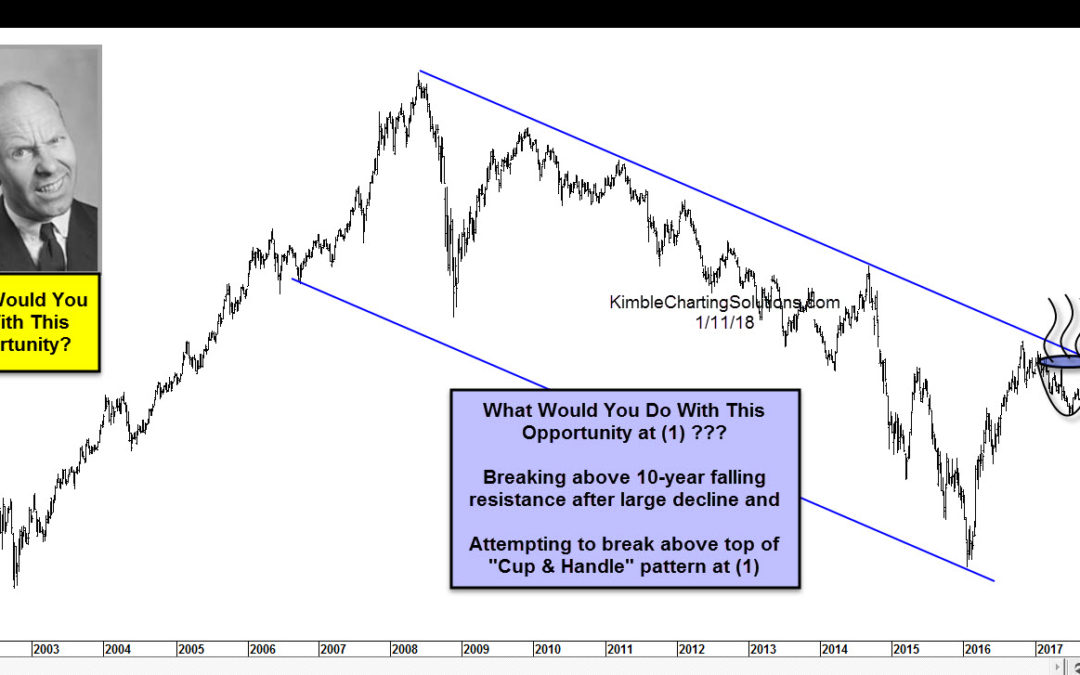
by Chris Kimble | Jan 11, 2018 | Kimble Charting
CLICK ON CHART TO ENLARGE This asset has been hit hard over the past 9-years. Despite the rally of late, it is still 90% below its old highs. It is attempting to break above a 9-year falling channel and above the top of a potential “Cup & Handle”...
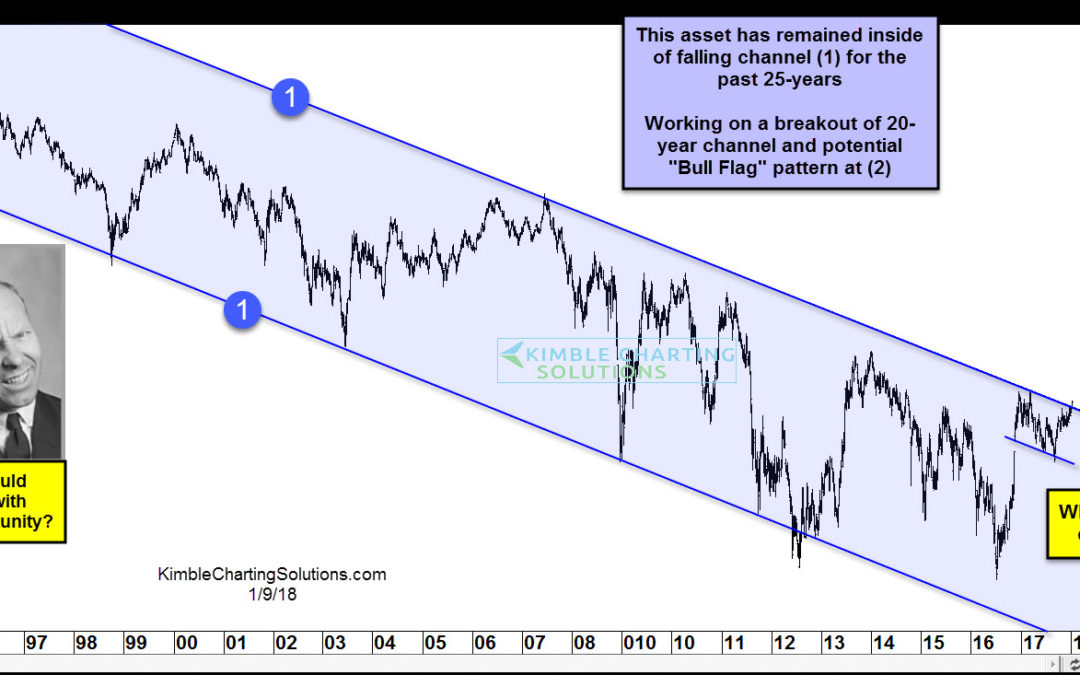
by Chris Kimble | Jan 9, 2018 | Kimble Charting
Below looks at an asset since the early 1990’s. A solid falling channel is in play over the past 25-years- CLICK ON CHART TO ENLARGE This asset is attempting to breakout of the 25-year falling channel at (2). This breakout could be a breakout of a bull flag...

by Chris Kimble | Dec 8, 2017 | Kimble Charting
Below looks at an asset that fell over 90% the past couple of years. Is an opportunity at hand? If so what would you do? CLICK ON CHART TO ENLARGE The 90% decline took this asset down to test 20-year rising support line (2), which so far has held. What would you do...

by Chris Kimble | Nov 3, 2017 | Kimble Charting
Three weeks ago the Power of the Pattern shared what looked like a great opportunity in the chart below…See original post HERE CLICK ON CHART TO ENLARGE At the time we shared that Premium and Sector members owned this position and if you wanted to know what this...

by Chris Kimble | Feb 22, 2017 | Kimble Charting
Below looks at an asset that has had a rough couple of years. The Power of the Pattern feels a nice risk/reward pattern is in play. CLICK ON CHART TO ENLARGE What would you do with this pattern? Long, Short or Avoid at (1). We would like to hear how you feel this...

by Chris Kimble | Dec 1, 2016 | Kimble Charting
Below looks at a chart, with a unique Power of the Pattern set up- CLICK ON CHART TO ENLARGE A “Cluster” has formed at (1), what would you do with this opportunity? We will be sharing this pattern with Premium and Sector members today in our weekly...
