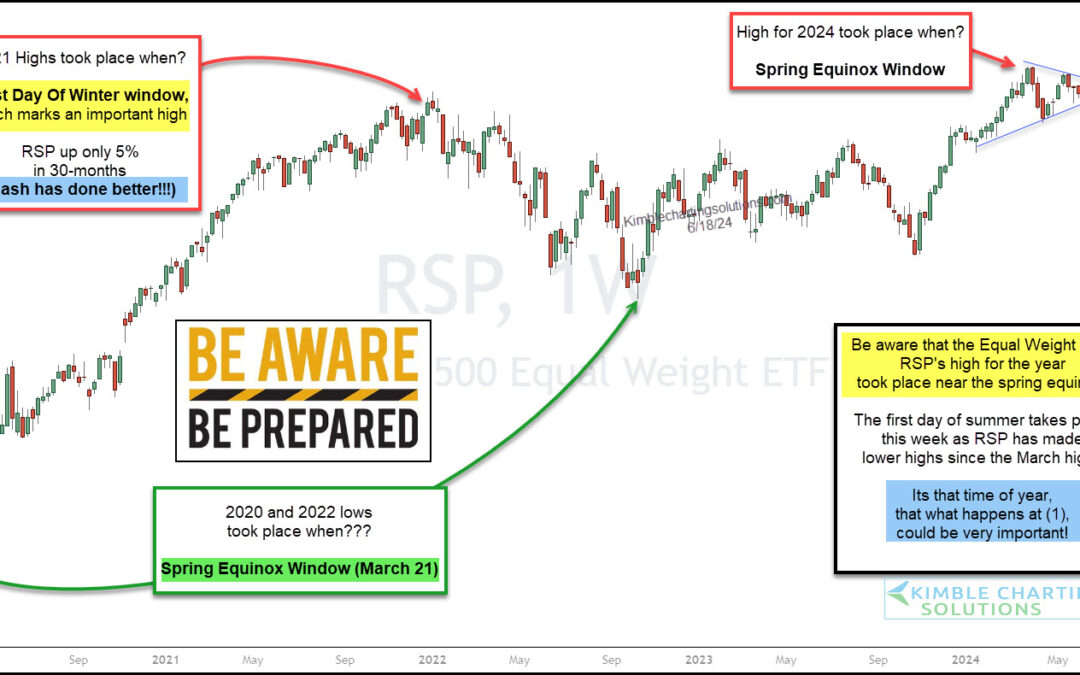
by Chris Kimble | Jun 20, 2024 | Kimble Charting
Whether the stock market is trending higher or lower, or even trading sideways, I’ve always found it helpful to watch the equal weight indices for insights about market breadth and market health. So today, with the S&P 500 Index trading near highs, I think it’s a...
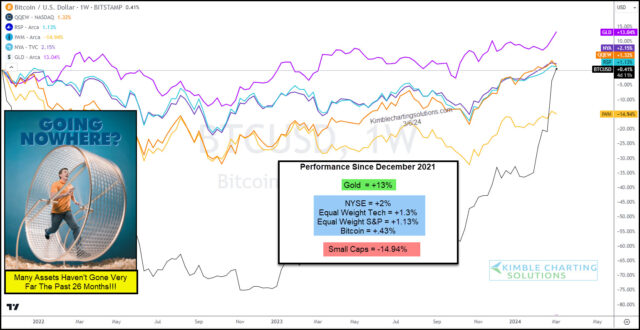
by Chris Kimble | Mar 8, 2024 | Kimble Charting
Several indicators of investor sentiment are showing rising “greed” levels. And when investors get greedy, it tends to imply that we are nearing a top. BUT, I am unsure why greed levels are so high when so many assets have little to brag about over the past few years!...
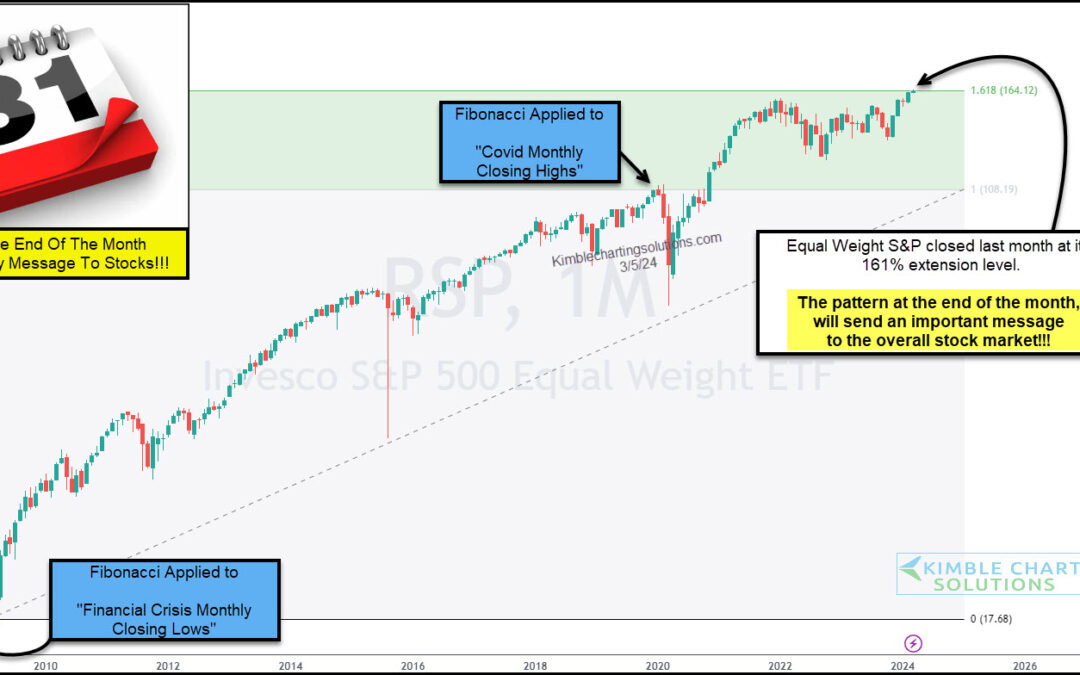
by Chris Kimble | Mar 6, 2024 | Kimble Charting
The latest stock market rally has taken several key indices to new highs. One such index is the Equal Weight S&P 500. While this is bullish, today’s long-term “monthly” chart of the Equal Weight S&P 500 ETF (RSP) shows price running into a big Fibonacci...
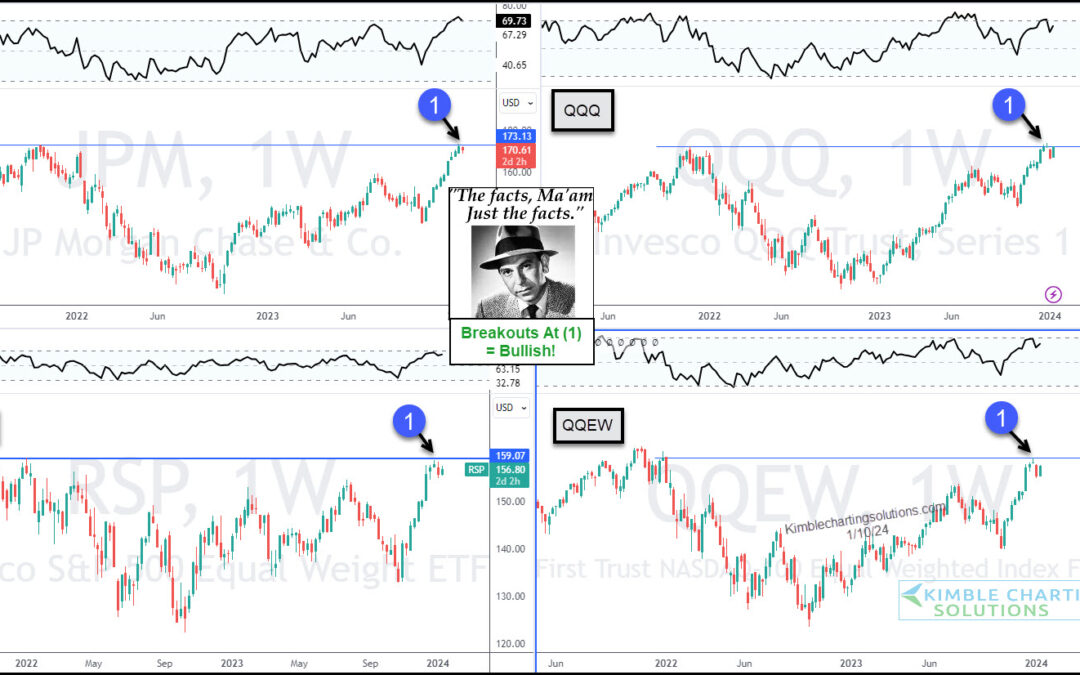
by Chris Kimble | Jan 12, 2024 | Kimble Charting
After a big year-end rally, the stock market attempts to consolidate gains in January. That consolidation has several stock indices and ETFs trading near recent price highs. “The facts, Ma’am. Just the facts.” – Joe Friday Today’s chart 4-Pack highlights a key bank...
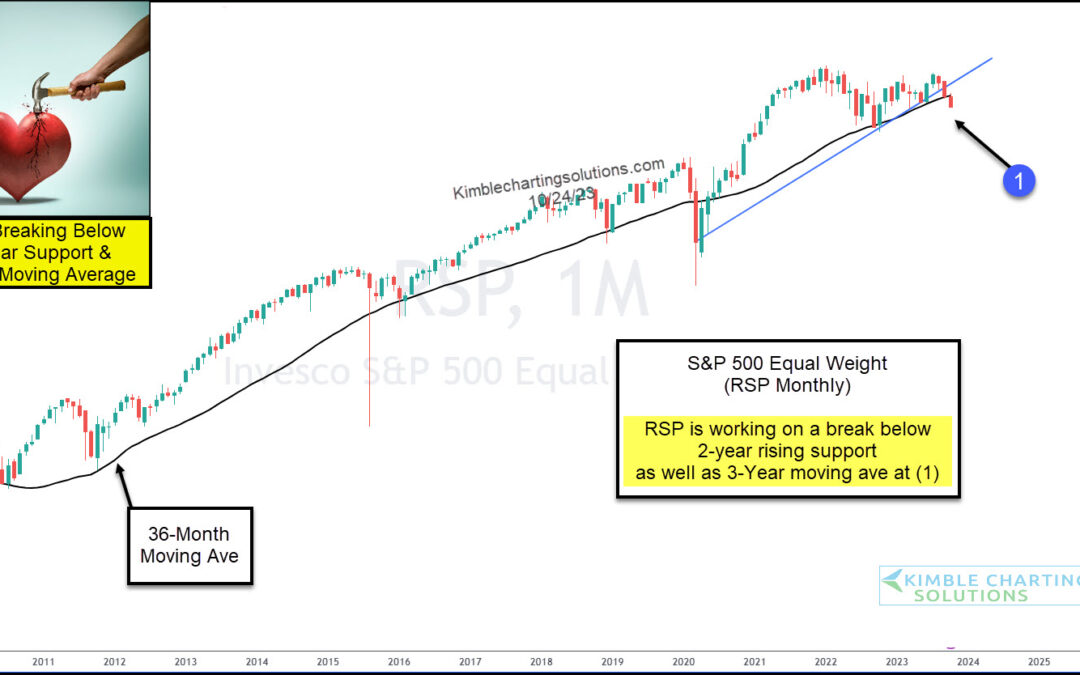
by Chris Kimble | Oct 26, 2023 | Kimble Charting
When evaluating the stock market, looking at several key indicators to evaluate risk and positioning is good. And sometimes, those indicators are actual stock market indices or index ETFs. In today’s case, it’s an index ETF. Today, we look at a long-term “monthly”...
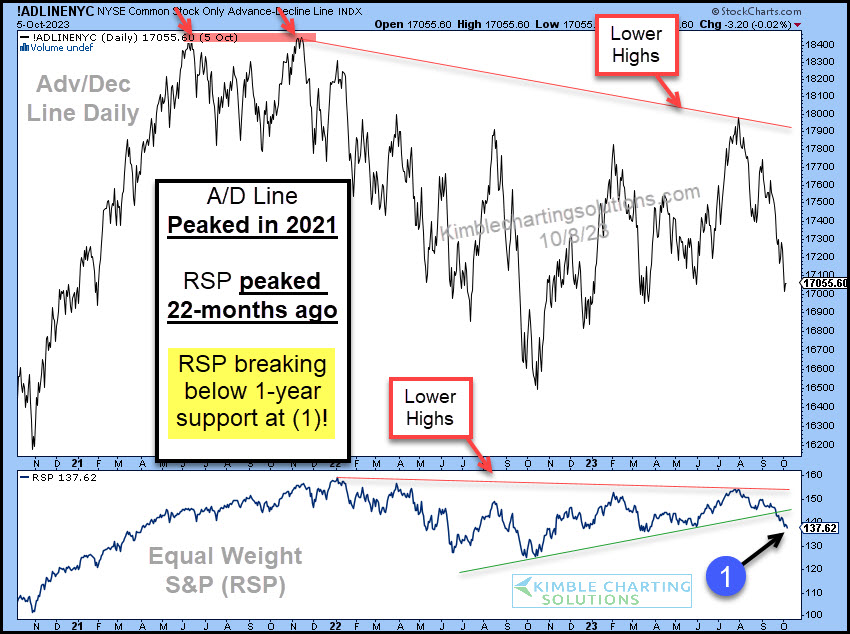
by Chris Kimble | Oct 11, 2023 | Kimble Charting
When market breadth turns south, savvy investors know that it’s time to remain cautious. And that’s been the case for the past several weeks. And it’s looking perhaps even worse today. Below are charts of the NYSE Advance-Decline Line (upper pane) and the Equal Weight...

by Chris Kimble | Oct 13, 2022 | Kimble Charting
Looking across the U.S. stock market indices and sectors, one thing is apparent: Growth stocks are getting hit hard. Just this week we wrote about a key “growth” indicator that was lagging. And one of the main spaces within the growth arena is technology stocks. And...

by Chris Kimble | May 20, 2019 | Kimble Charting
The rally off the December stock market lows has been strong, to say the least. The S&P 500 rallied 25 percent before hitting and testing the 2018 high. The old highs proved to be formidable resistance and ushered in some volatility in May… and a 5 percent...
