by Chris Kimble | May 10, 2019 | Kimble Charting
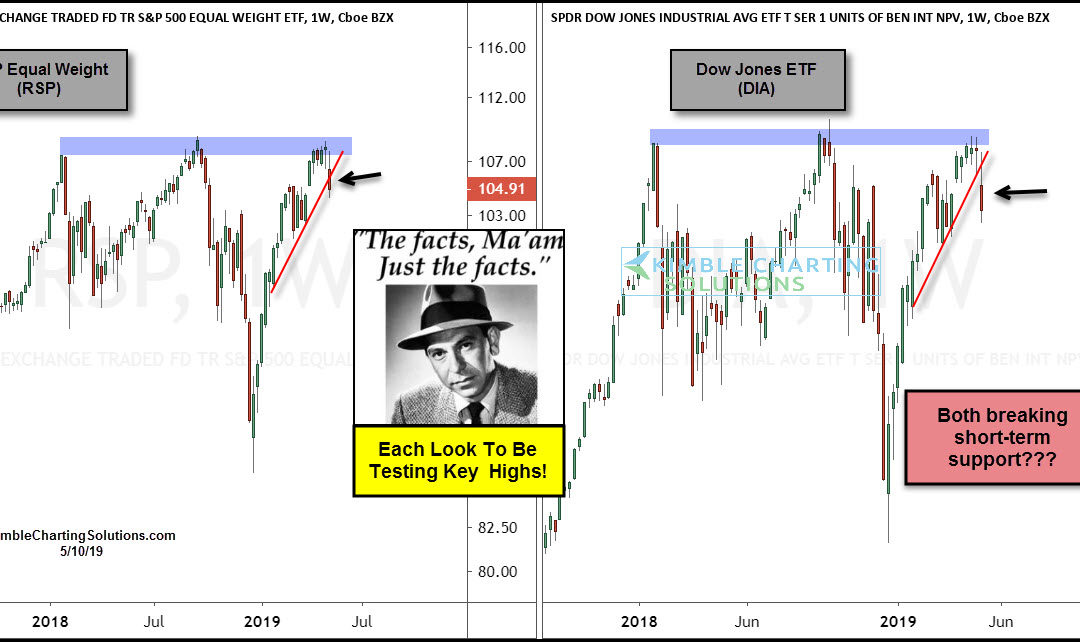
Could the Dow and the S&P both be triple topping at the same time? Possible says Joe Friday This 2-pack looks at the Dow ETF (DIA) and the Equal Weight S&P ETF (SPY) over the past 18-months. Joe Friday Just The Facts Ma’am- Each could be triple topping...
by Chris Kimble | Apr 22, 2019 | Kimble Charting
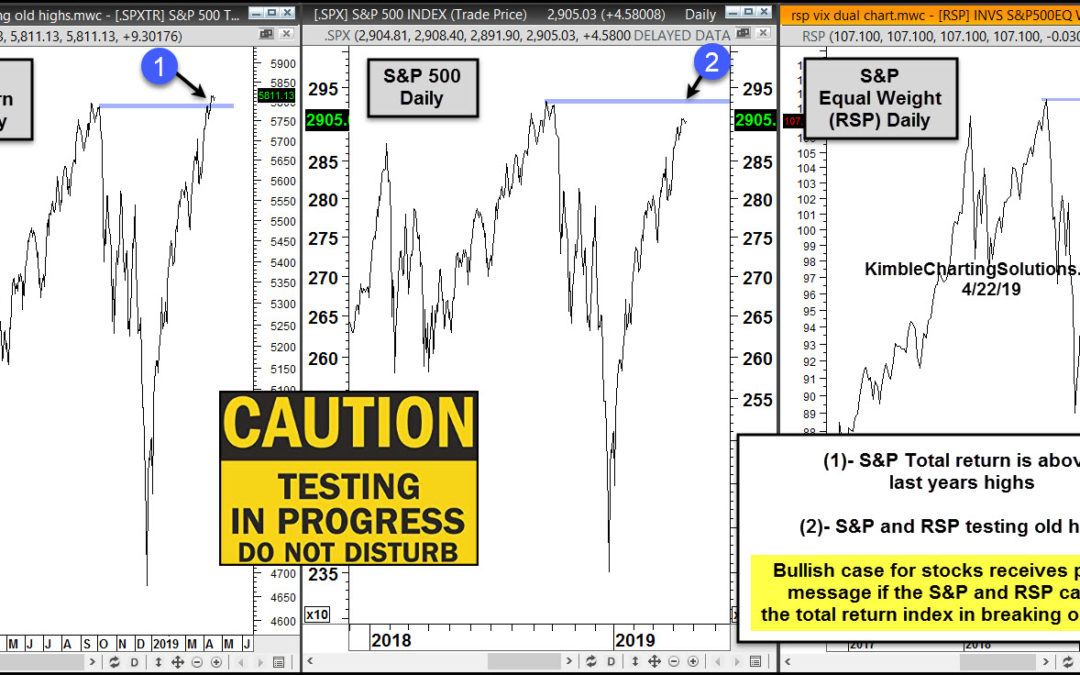
Are all S&P 500 Indices/ETF’s built exactly the same and pattern identical? Nope! This 3-packs looks at the S&P 500 Total return index, the S&P 500 cap weighted index (SPY) and the S&P 500 equal weight ETF (RSP). All three look to be experiencing...
by Chris Kimble | Jan 17, 2019 | Kimble Charting
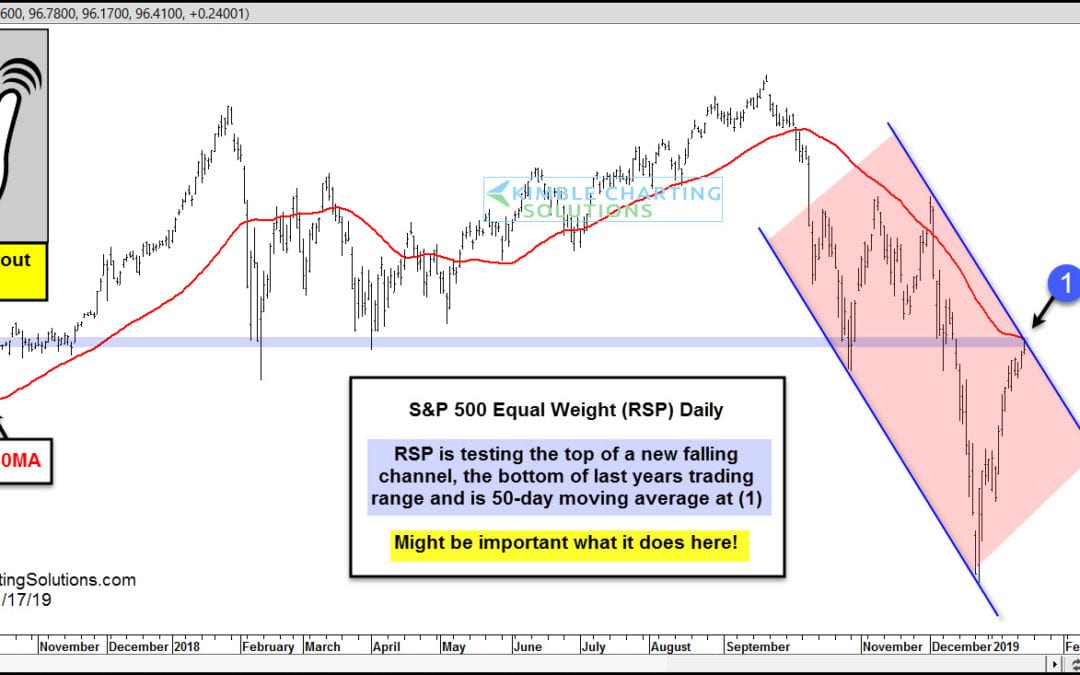
Is the rally of late about to run out of steam or is a major breakout about to take place in the S&P 500? What happens at current prices should go a long way in determining this question. This chart looks at the equal weight S&P 500 ETF (RSP) on a daily basis...
by Chris Kimble | Aug 4, 2018 | Kimble Charting
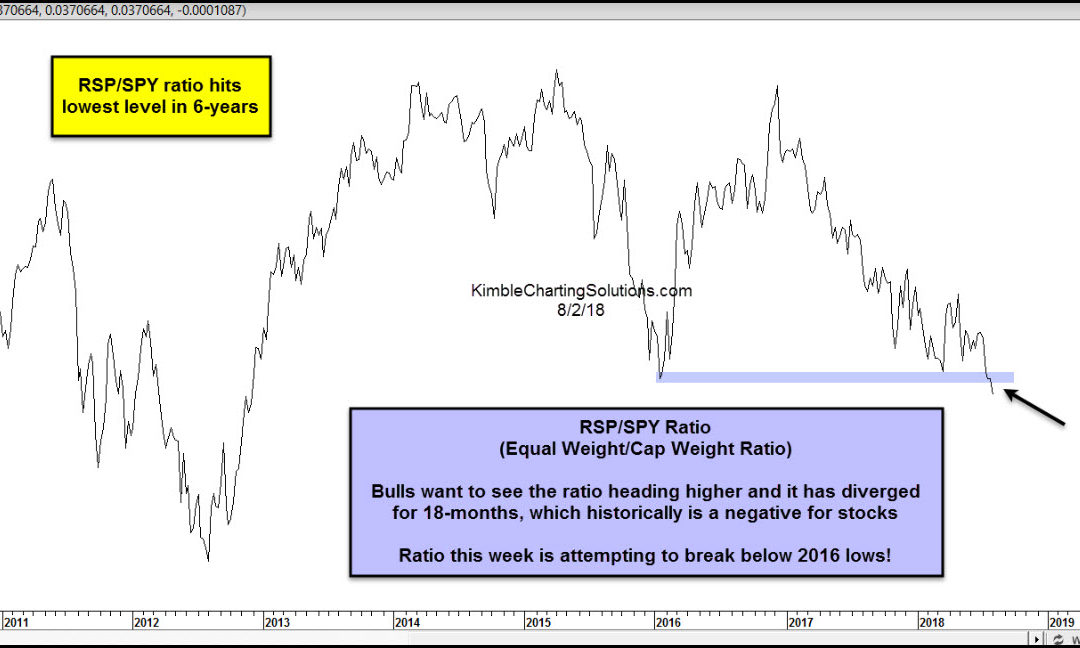
In trading, all that matters is price. And I tend to look use it to identify patterns that can help investors and traders. We can also use market ratios as a gauge of the stock market’s health. Today, we’ll look at the Invesco S&P 500 Equal Weight ETF $RSP vs the...

by Chris Kimble | Nov 6, 2017 | Kimble Charting
The 2-pack below compares the Cap weighted and Equal weighted performance year to date of the S&P 500 and Nasdaq 100- CLICK ON CHART TO ENLARGE The chart above reflects that the equal-weighted S&P 500 ETF (RSP) and the equal weighted NDX 100 ETF (QQQE) have...

by Chris Kimble | Jun 22, 2017 | Kimble Charting
When it comes to S&P 500 ETF’s, they may be equal (who stocks they own), yet they can be much different when it comes to performance. Below compares the Equal Weight S&P 500 ETF (RSP) to the S&P 500 (which is Cap Weighted), since the 2009 lows. Which...
by Chris Kimble | Apr 29, 2011 | Kimble Charting
Earlier in the week the “Power of the Pattern” was suggesting that investors should be prepared for a breakout at (1) (see post here) CLICK ON CHART TO ENLARGE So far the daily and weekly chart price action is quality at (2), per pushing above...

by Chris Kimble | Apr 27, 2011 | Kimble Charting
CLICK ON CHART TO ENLARGE Europe and the U.S. may be miles apart, yet these patterns of the EAFE & 500 index look very much the same! Potential neckline breakout of an “inverse Bullish Head & Shoulders” pattern could be at hand! ...
