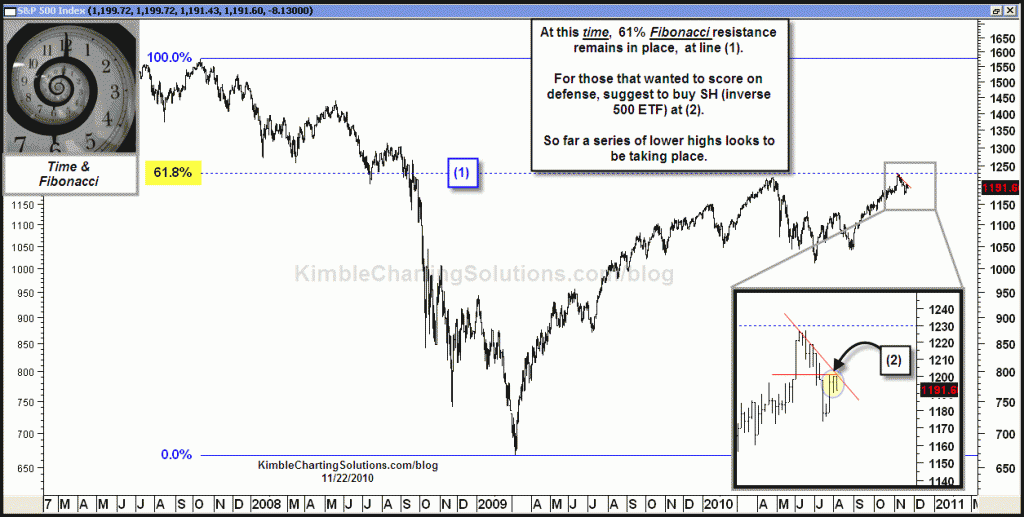
by Chris Kimble | Nov 22, 2010 | Kimble Charting
Last Thursday morning, I suggested that aggressive investors could pick up the inverse 500 ETF (SH), due to a key falling resistance line that looked to be taking shape. (see post here) CLICK ON CHART TO ENLARGE Game Plan….Was suggested to pick up SH, with...

by Chris Kimble | Nov 17, 2010 | Kimble Charting
Suggested to “Buy the inverse Grains ETF” (AGA) last Friday morning. (see post here) See update below. CLICK ON CHART TO ENLARGE Game Plan…AGA is up over 20% since its breakout. decent gains in 4 business days, since the purchase at...

by Chris Kimble | Nov 17, 2010 | Kimble Charting
Suggested to take a position to “Score on defense” in the Crude Oil arena last Friday morning, by shorting oil/oil stocks. (see post here). See update of the inverse oil etf DTO. CLICK ON CHART TO ENLARGE Game Plan…Protect quick gains with a...
by Chris Kimble | Nov 16, 2010 | Kimble Charting
CLICK ON CHART TO ENLARGE Anyone notice what the “Patterns have been suggesting we should do” of late? Below is a small summary of suggestions from last week…. Widest Spread between the Nasdaq 100 and the VXN in almost 10 years, with the NDX at...
by Chris Kimble | Nov 12, 2010 | Kimble Charting
Pre-market this morning, I suggested for aggressive investors to look at picking up AGA, which is the 2x inverse grain ETF. (see post here) I have heard from many of you that you now own it… So far AGA is off to a decent start. Game Plan...
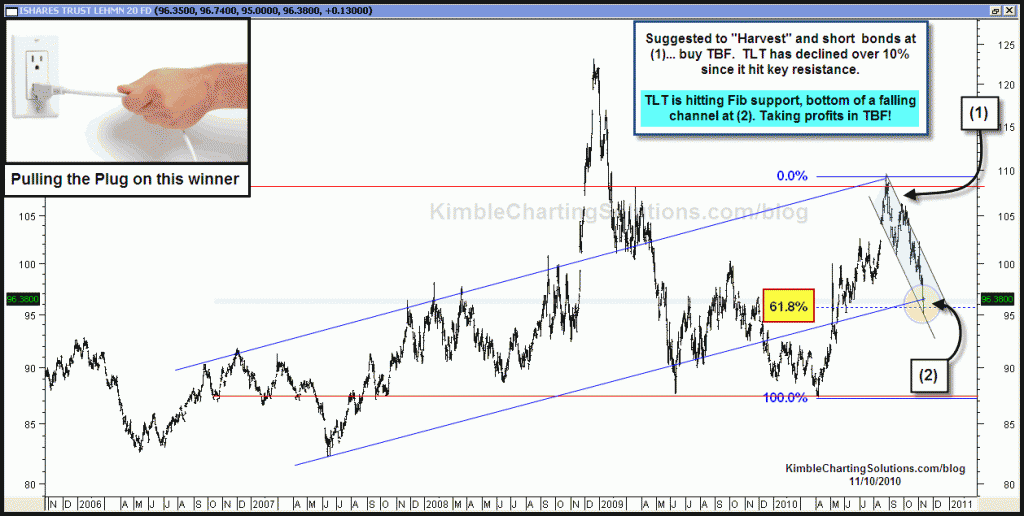
by Chris Kimble | Nov 10, 2010 | Kimble Charting
Taking profits in TBF (inverse bond EFT) at (2) in the chart below. TLT has declined over 10%, found the 61% Fibonacci retracement level at the bottom of two channels… CLICK ON CHART TO ENLARGE Will know the “Pocket Change Gain” tomorrow at the...
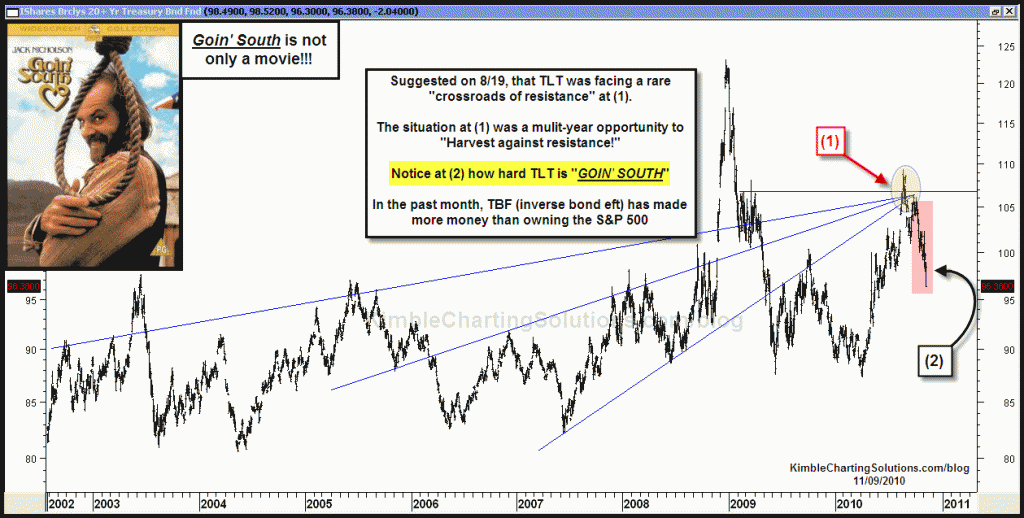
by Chris Kimble | Nov 9, 2010 | Kimble Charting
CLICK ON CHART TO ENLARGE TLT hit a crossroads of resistance at (1) and has been really falling hard of late! Suggested to “at least harvest” at this crossroads in the quiz on dshort. (See post here) GAME PLAN… Raise trailing stops to 3% right...

by Chris Kimble | Nov 3, 2010 | Kimble Charting
The chart below was the weekly Quiz on dshort.com, 8/18. Reflecting that numerous resistance lines were meeting at one price point. The “Power of the Pattern” was suggesting for investors to do what at (1)??? (see post here and answer). If you...
