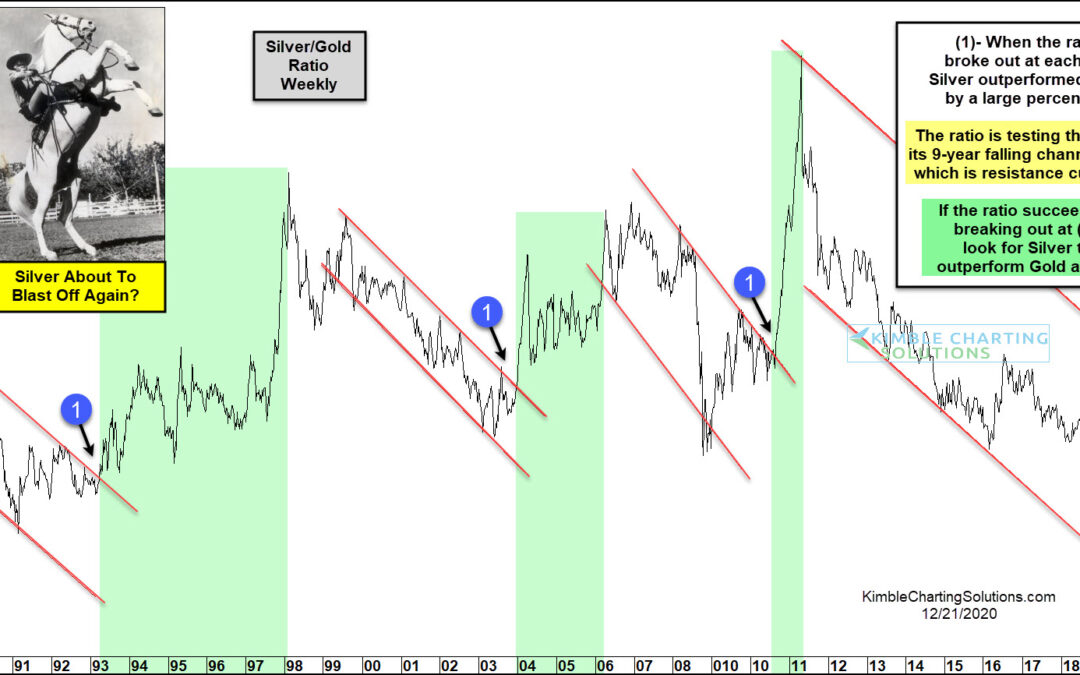
by Chris Kimble | Dec 21, 2020 | Kimble Charting
Precious metals are having a strong year in 2020. So is it any surprise that Silver has been leading Gold higher? As I’ve said before, Silver is to precious metals what small-cap stocks are to the broad market… it’s always beneficial when they lead In today’s chart...
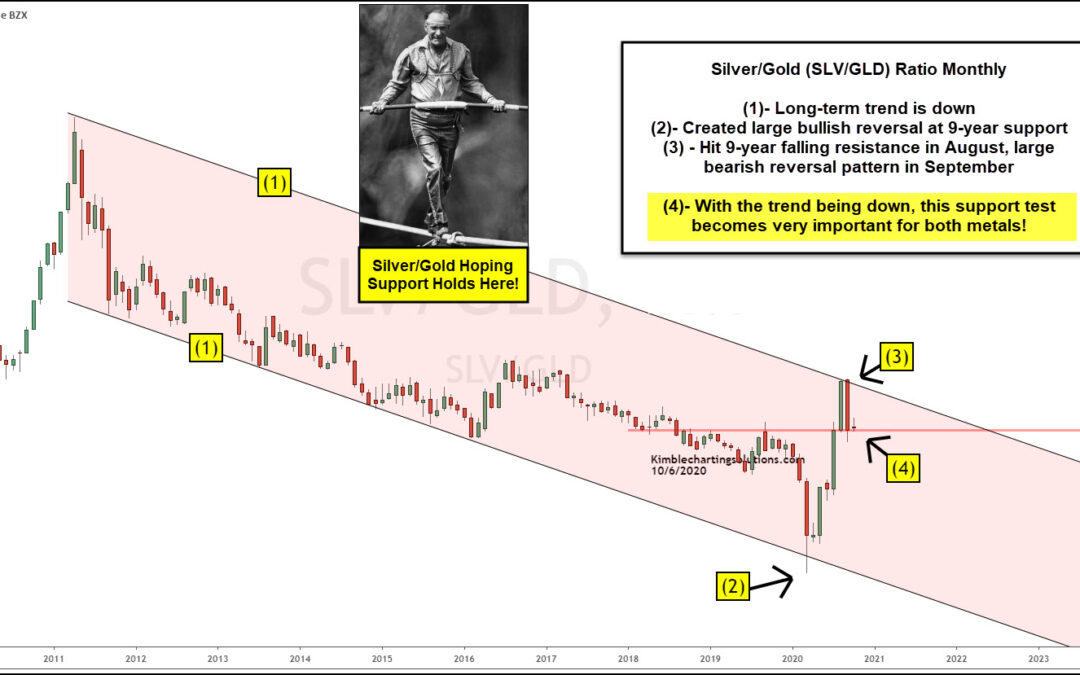
by Chris Kimble | Oct 8, 2020 | Kimble Charting
When precious metals are out-performing other asset classes, it usually means that Silver is also out-performing Gold. Silver means to Gold what small-caps and growth stocks mean to the broader stock market. Precious metals bulls want to see Silver leading Gold higher...
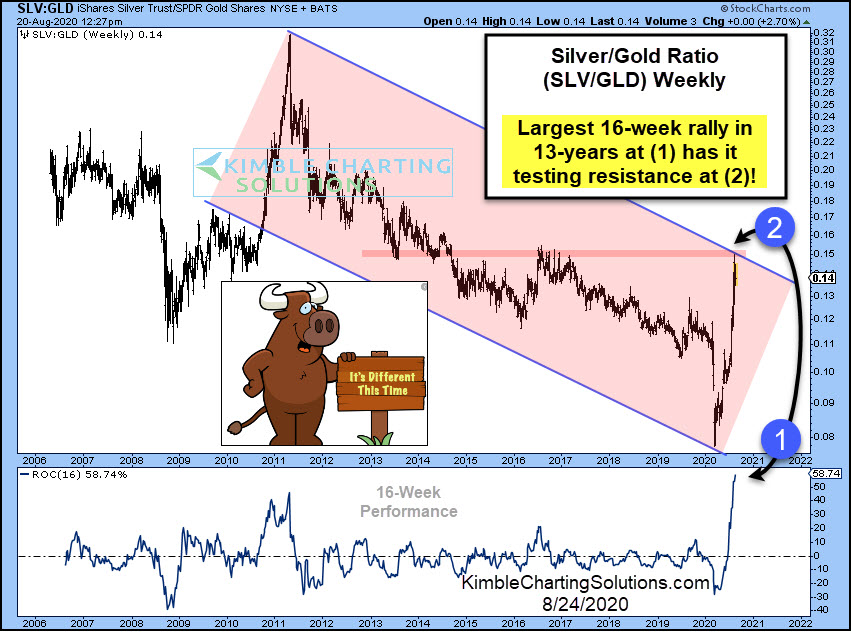
by Chris Kimble | Aug 24, 2020 | Kimble Charting
Precious metals have been a red-hot investment in 2020. Gold briefly broke $2000 this month, while Silver touched up near $30. But it’s been the rally in Silver prices that has been eye-popping. And perhaps a big reason for the extra momentum we saw this summer in...

by Chris Kimble | Jul 24, 2020 | Kimble Charting
For the first 4 months of this year (2020), Gold was the only bullish story in the precious metals sector. But come May, Silver began to perk up. And since then, Silver prices have been on a tear. In today’s chart, we look at the ratio of Silver (SLV) to Gold (GLD)...

by Chris Kimble | Jul 21, 2020 | Kimble Charting
Precious metals continue to out-perform in 2020 as uncertainty rules the day. Gold took the lead early and rallied sharply… and now Silver is following suit. When Silver joins the party, it tends to add “beta” to the rally, similar to the way the stock market likes...

by Chris Kimble | Apr 9, 2020 | Kimble Charting
Is an important metals indicator sending one of the largest bullish messages in nearly 50-years? Very Possible! This chart looks at the Silver/Gold ratio on a monthly basis since the mid-1970s. Historically metals bulls want to see the ratio heading up, to send the...

by Chris Kimble | Sep 3, 2019 | Kimble Charting
Investors that are Bullish Silver or Gold want to see the Silver/Gold ratio heading higher and breaking above key resistance levels. Early this month they are receiving a long-awaited bullish message! The Silver/Gold ratio has created a series of lower highs and lower...
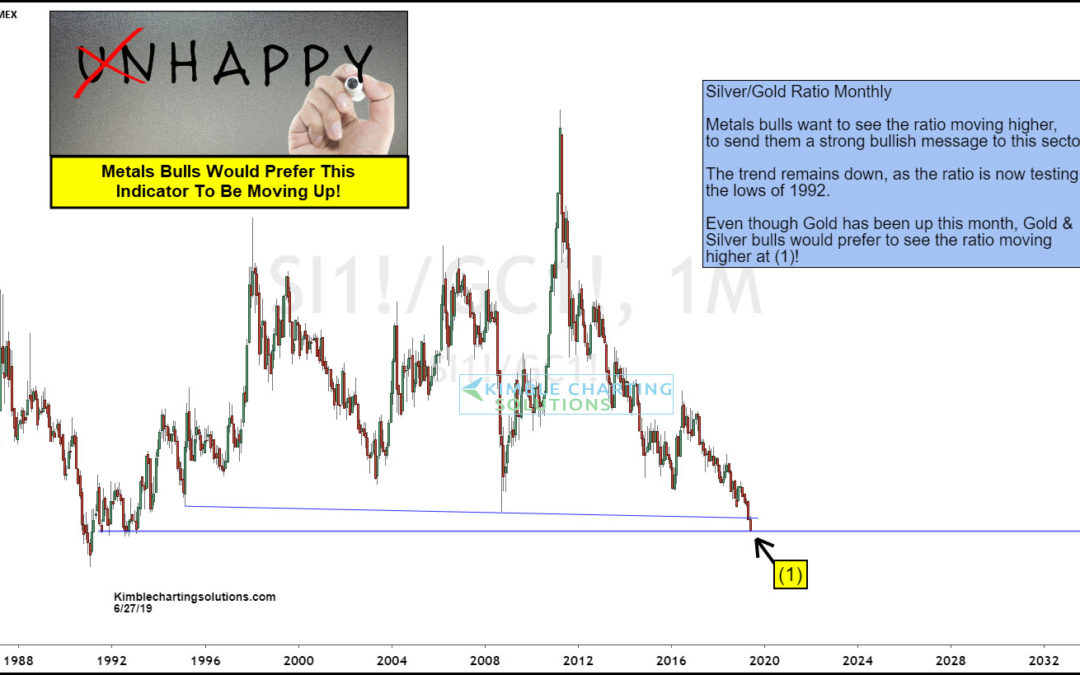
by Chris Kimble | Jun 27, 2019 | Kimble Charting
This chart looks at the Silver/Gold ratio over the past 25-years. Historically bullish investors in Gold & Silver receive a positive message when this ratio is heading higher. When the ratio is heading lower, historically rallies in Gold often times have been...
