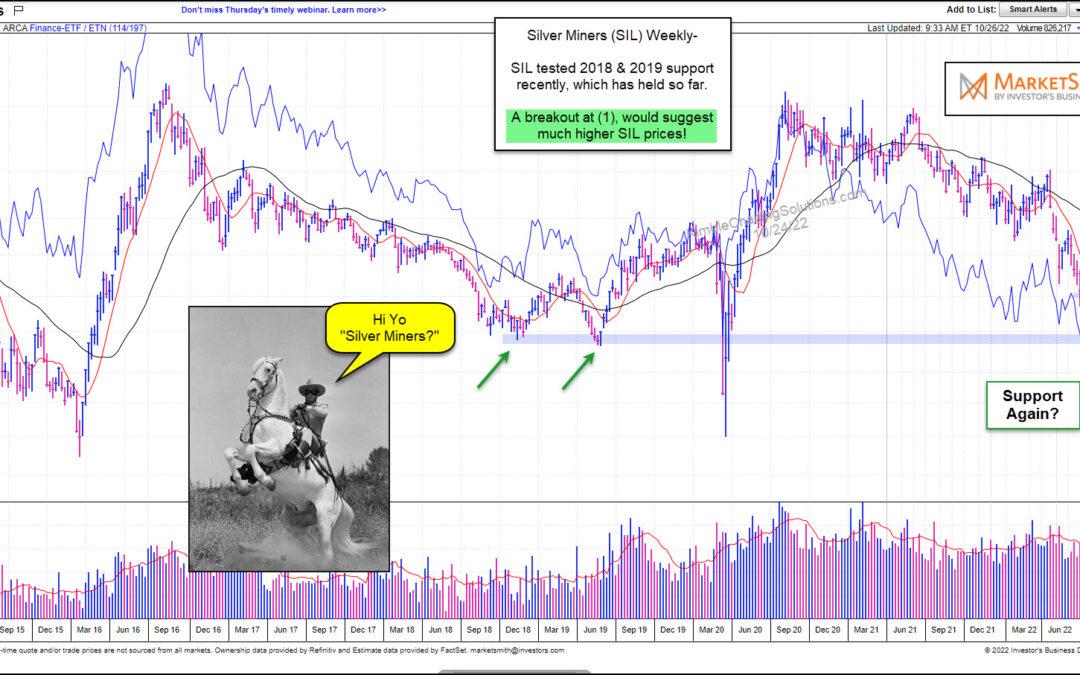
by Chris Kimble | Oct 27, 2022 | Kimble Charting
The precious metals arena has seen gold and silver pull back and consolidate for several months. And this, coupled with a bear market in equities has brought down precious metals mining stocks. But the miners are starting to show life. And if King Dollar slows its...
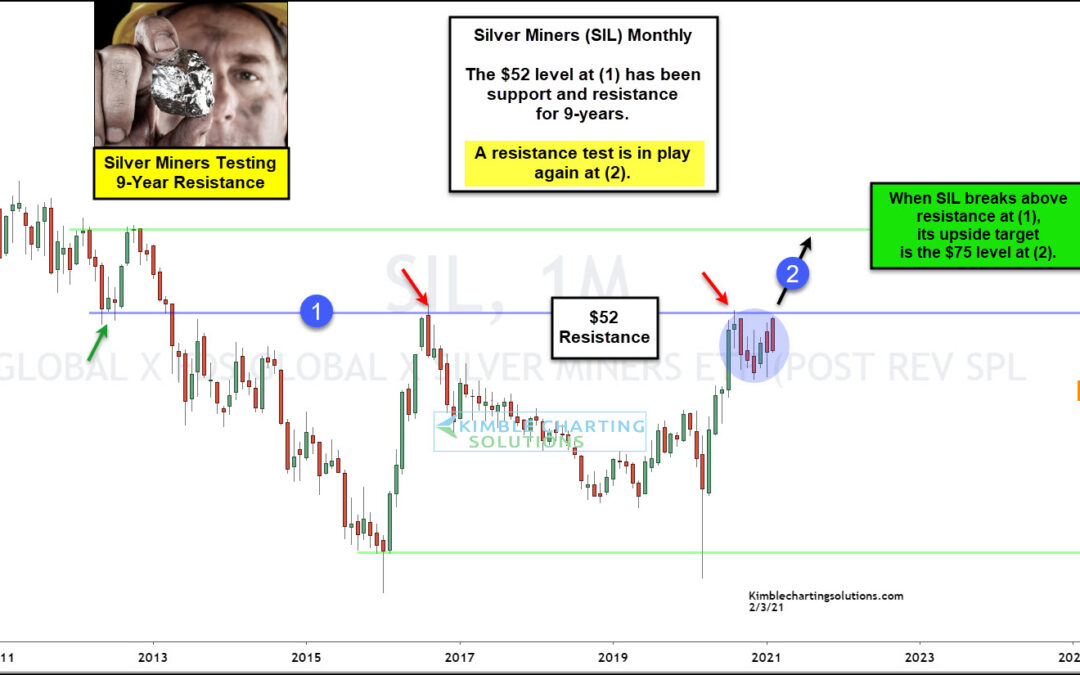
by Chris Kimble | Feb 4, 2021 | Kimble Charting
In less than a year’s time, the price of Silver has rallied from around $12 dollars to the recent highs just over $30. That’s quite a rally! And when Silver is in rally mode, it benefits the entire industry, including the Silver Miners. Today’s chart is a long-term...
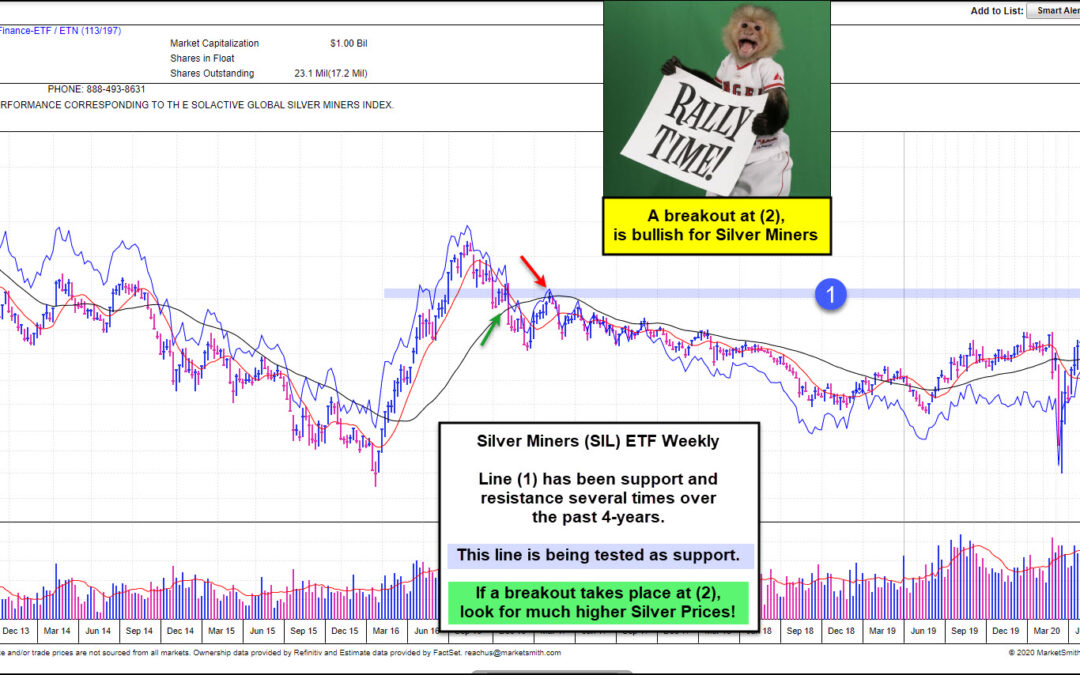
by Chris Kimble | Nov 5, 2020 | Kimble Charting
Are Silver Miners about to experience a bullish breakout? Sure could be! This chart looks at Silver Miners (SIL) from Marketsmith.com. Click here to see how to get Investors Daily FREE for 3-weeks! Line (1) has become support and resistance several times over the past...
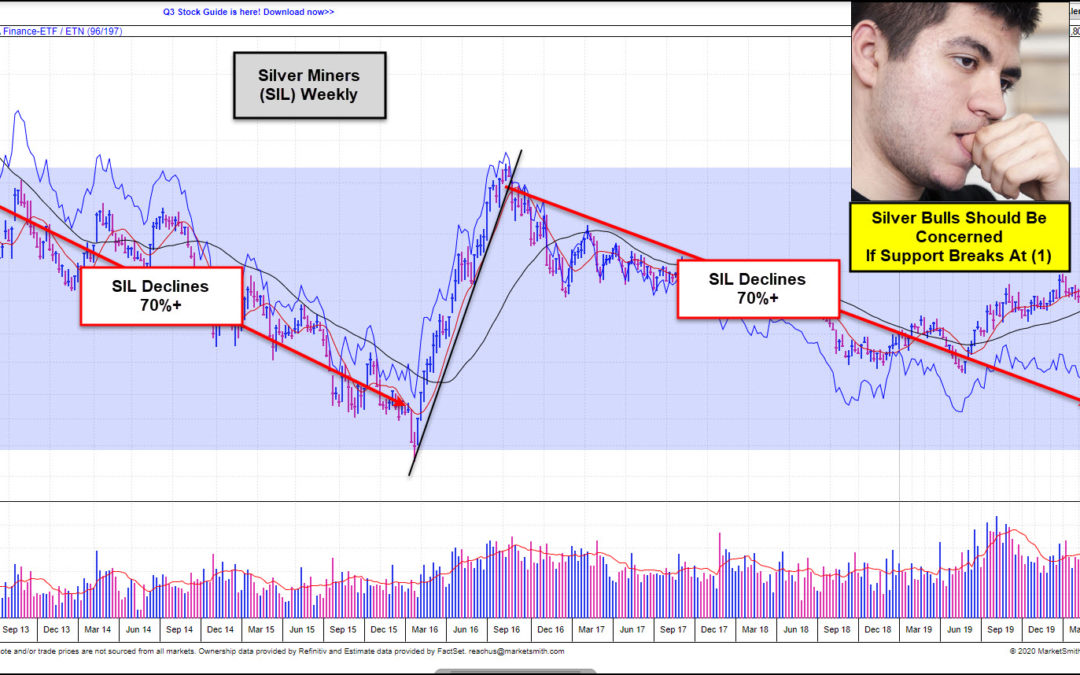
by Chris Kimble | Aug 20, 2020 | Kimble Charting
Are Silver Miners (SIL) at an important price point this week? Yes! This chart looks at SIL on a weekly over the past 8-years. When SIL hit the top of this trading range in 2013 and 2016, it failed to breakout, which was followed by a 70%+ decline in price. The...
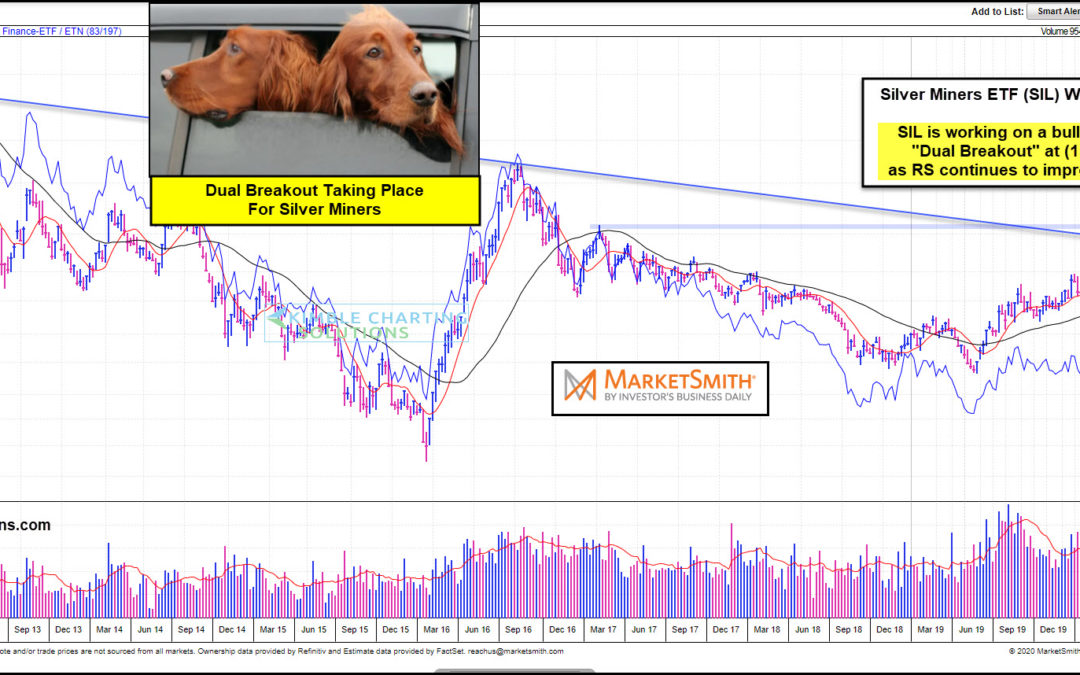
by Chris Kimble | Jul 21, 2020 | Kimble Charting
Its been a long struggle to move higher for Silver Miners ETF (SIL) as it has created a series of lower highs since 2012. Is the long-term trend for this ETF about to change? An important move is taking place of late! This chart from Marketsmith.com reflects that SIL...
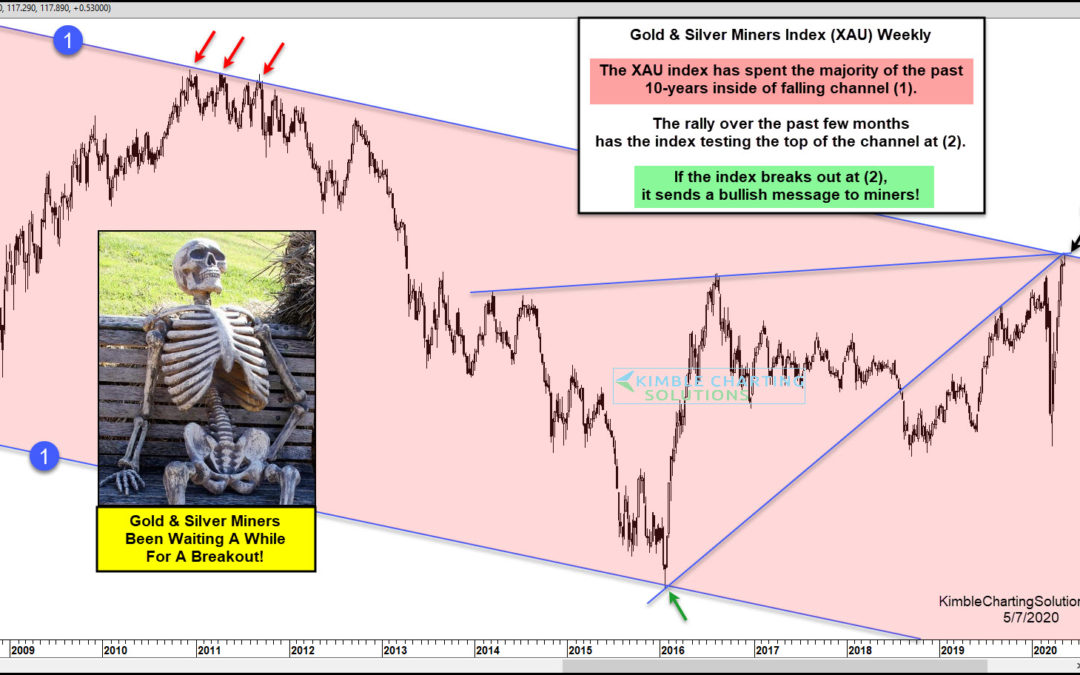
by Chris Kimble | May 7, 2020 | Kimble Charting
Are Gold & Silver Miners about to send a bullish message for the first time in 10-Years? We will see soon! The Gold & Silver Miners Index (XAU) has created a series of lower highs and lower lows inside of falling channel (1) over the past decade-plus. The...
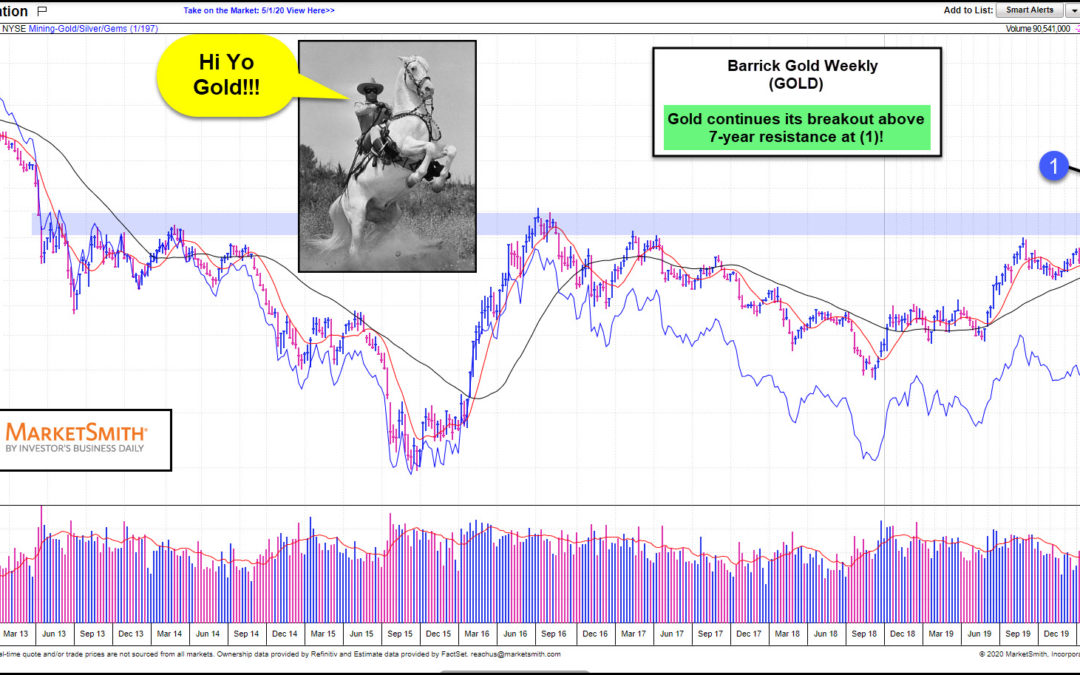
by Chris Kimble | May 2, 2020 | Kimble Charting
Is it “Hi-Yo Gold” time? At least in the short-term, it is! This chart looks at Barrick Gold Corp (GOLD) on a weekly basis. Gold has struggled to break above the blue shaded resistance zone for years, which comes into play just below the $23 level. This...
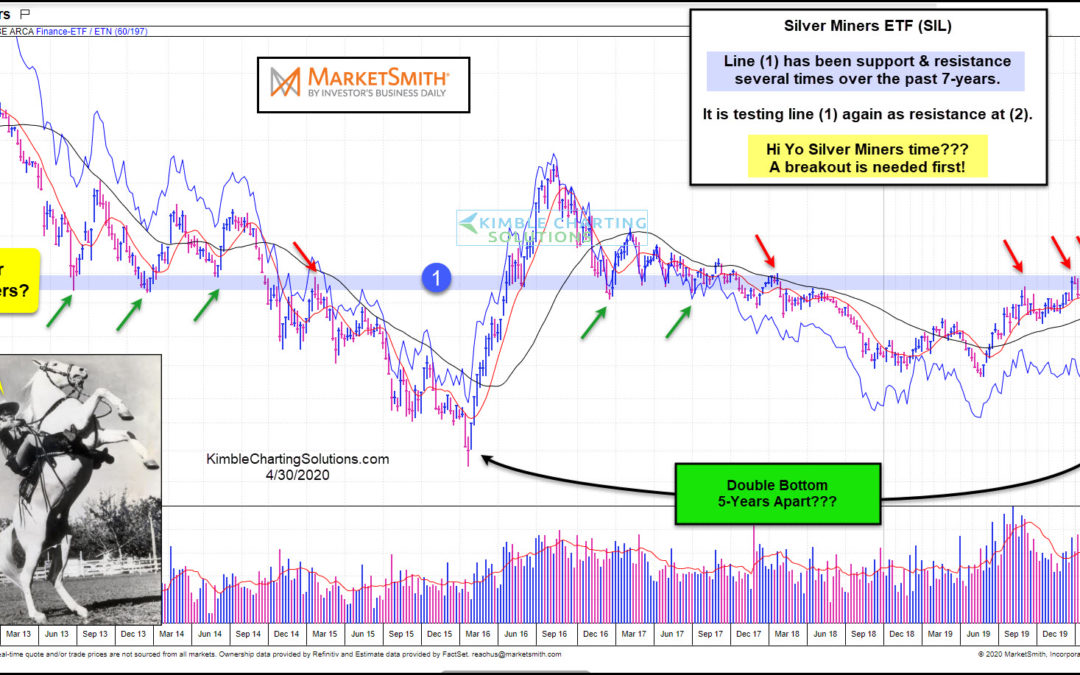
by Chris Kimble | Apr 30, 2020 | Kimble Charting
It is Hi-Yo Silver Miners Time for miners? We could find out real soon, as Silver Miners ETF (SIL) is testing a key breakout level. The sharp decline in March saw SIL test the 2015 lows, creating the potential for a long-term double bottom. This chart from...
