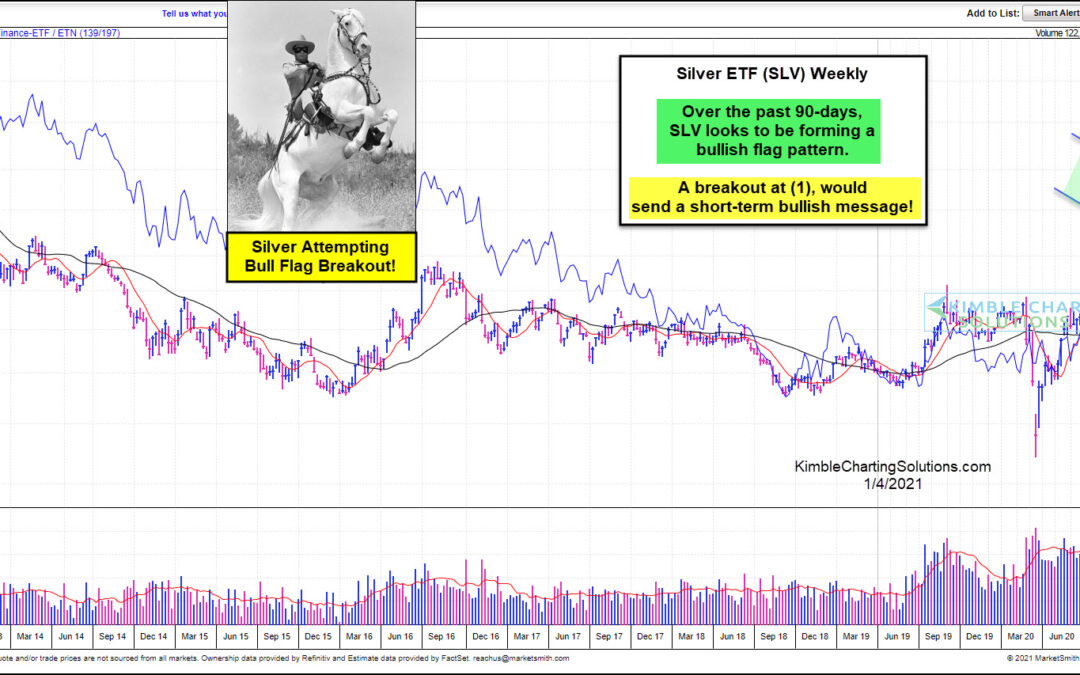
by Chris Kimble | Jan 4, 2021 | Kimble Charting
Is a Hi-Yo Silver bullish message about to take place in the short-term? This chart from Marketsmith.com suggests that a breakout attempt from a bull flag pattern is being attempted. Since peaking in August of 2020, Silver ETF (SLV) has created a series of lower...
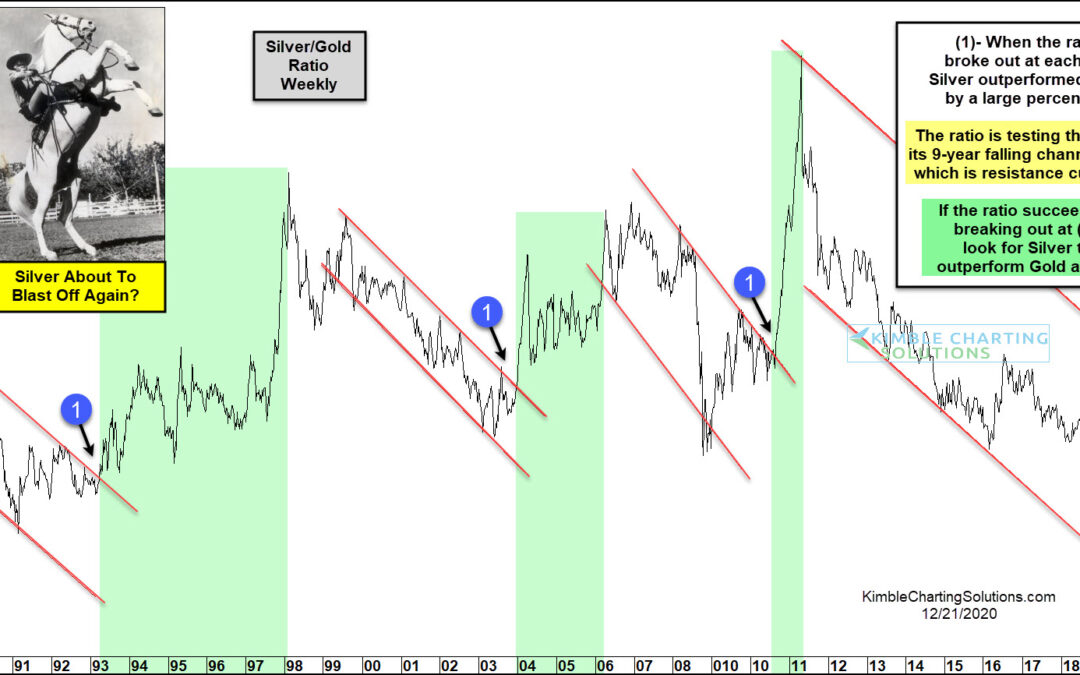
by Chris Kimble | Dec 21, 2020 | Kimble Charting
Precious metals are having a strong year in 2020. So is it any surprise that Silver has been leading Gold higher? As I’ve said before, Silver is to precious metals what small-cap stocks are to the broad market… it’s always beneficial when they lead In today’s chart...
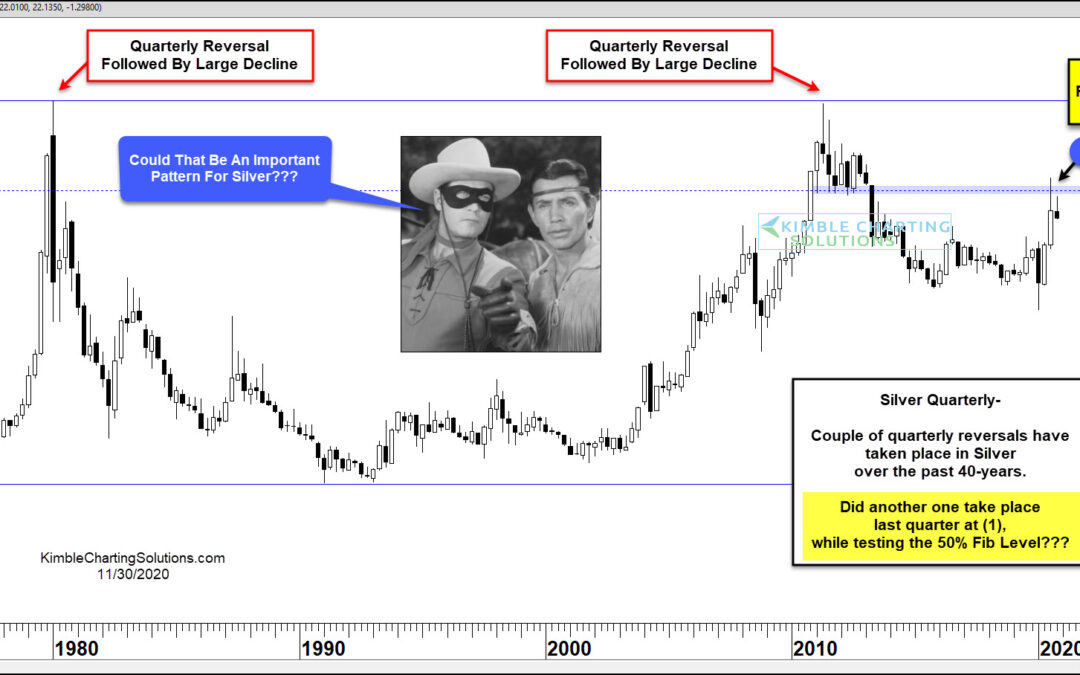
by Chris Kimble | Nov 30, 2020 | Kimble Charting
Precious metals caught lightning in a bottle for the first 7 months of the year, with Gold notching new all-time highs and Silver making to multi-year highs in August. But both have reversed lower since peaking in August and investors should pay attention. It might be...
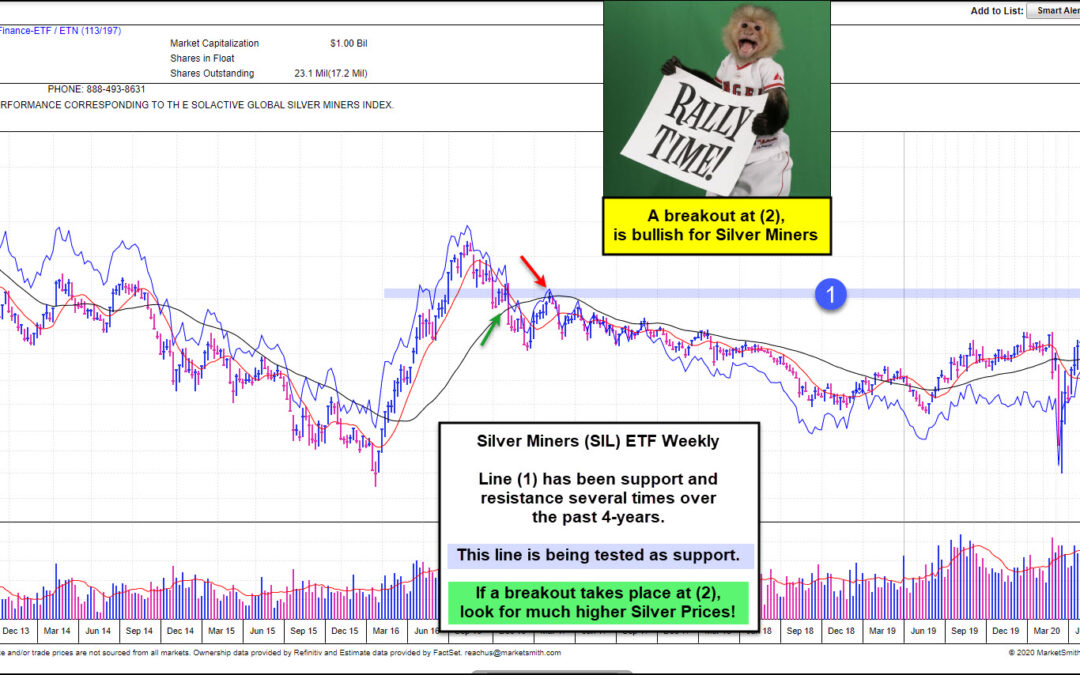
by Chris Kimble | Nov 5, 2020 | Kimble Charting
Are Silver Miners about to experience a bullish breakout? Sure could be! This chart looks at Silver Miners (SIL) from Marketsmith.com. Click here to see how to get Investors Daily FREE for 3-weeks! Line (1) has become support and resistance several times over the past...
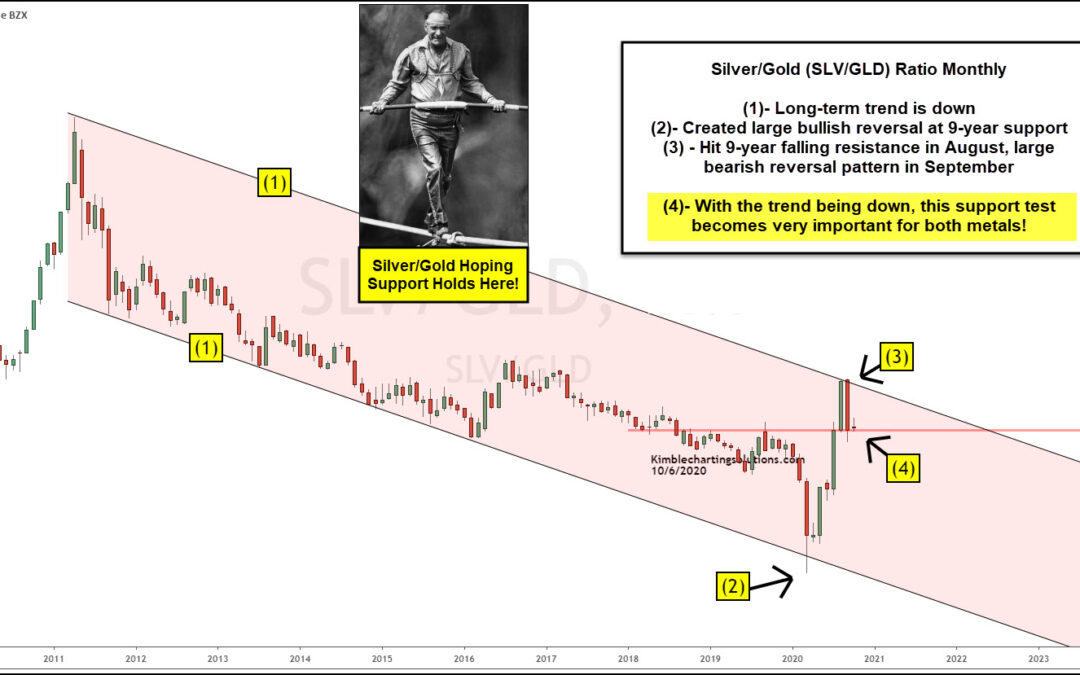
by Chris Kimble | Oct 8, 2020 | Kimble Charting
When precious metals are out-performing other asset classes, it usually means that Silver is also out-performing Gold. Silver means to Gold what small-caps and growth stocks mean to the broader stock market. Precious metals bulls want to see Silver leading Gold higher...
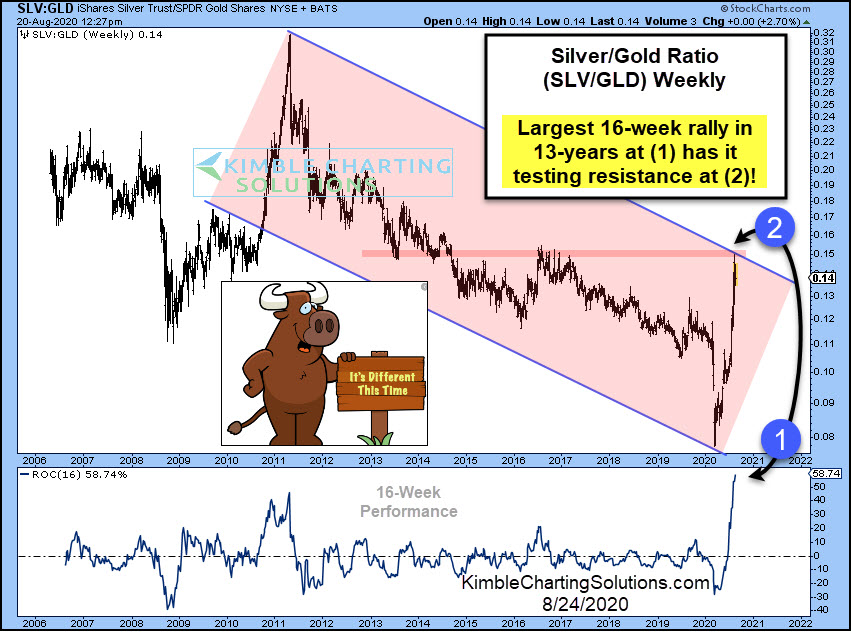
by Chris Kimble | Aug 24, 2020 | Kimble Charting
Precious metals have been a red-hot investment in 2020. Gold briefly broke $2000 this month, while Silver touched up near $30. But it’s been the rally in Silver prices that has been eye-popping. And perhaps a big reason for the extra momentum we saw this summer in...
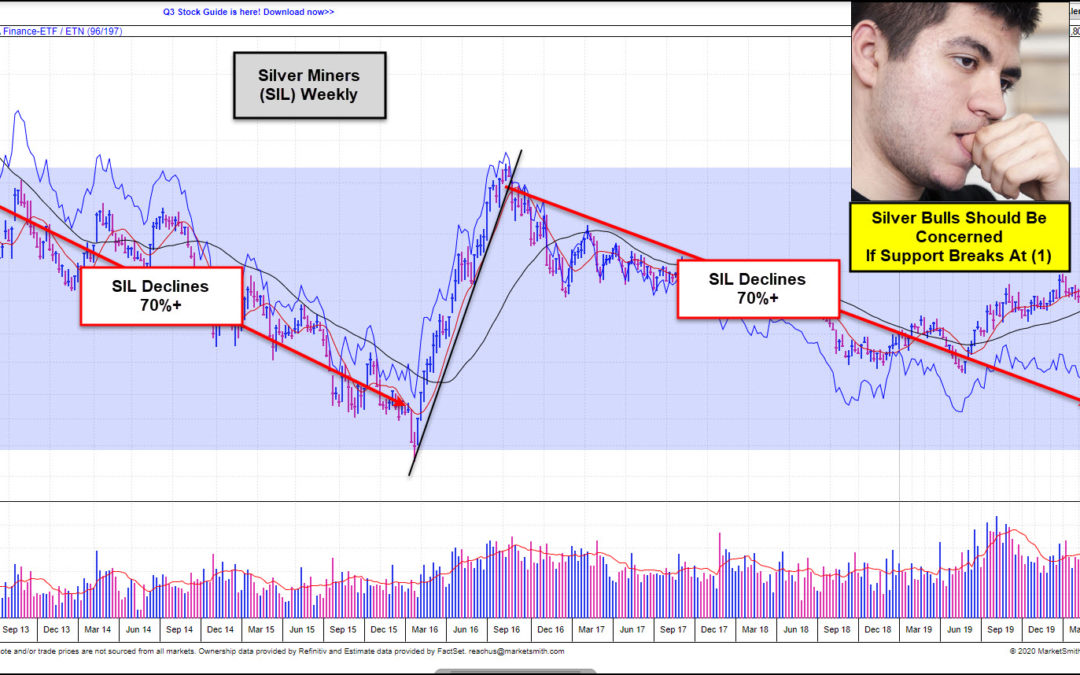
by Chris Kimble | Aug 20, 2020 | Kimble Charting
Are Silver Miners (SIL) at an important price point this week? Yes! This chart looks at SIL on a weekly over the past 8-years. When SIL hit the top of this trading range in 2013 and 2016, it failed to breakout, which was followed by a 70%+ decline in price. The...
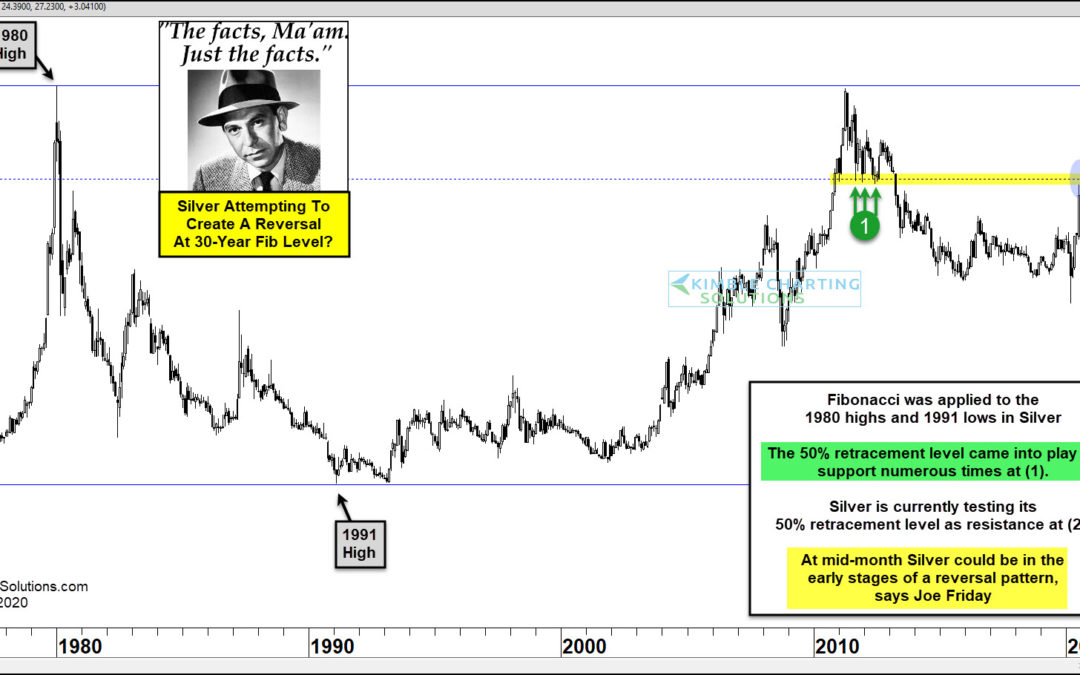
by Chris Kimble | Aug 14, 2020 | Kimble Charting
Could Silver prices from 30-years ago be influencing price action this month? Joe Friday suggests it is possible. This chart looks at Silver Futures on a monthly basis over the past 40-years. Fibonacci levels were applied to the 1980 highs ($50) and 1991 lows ($.350)...
