by Chris Kimble | Aug 14, 2020 | Kimble Charting
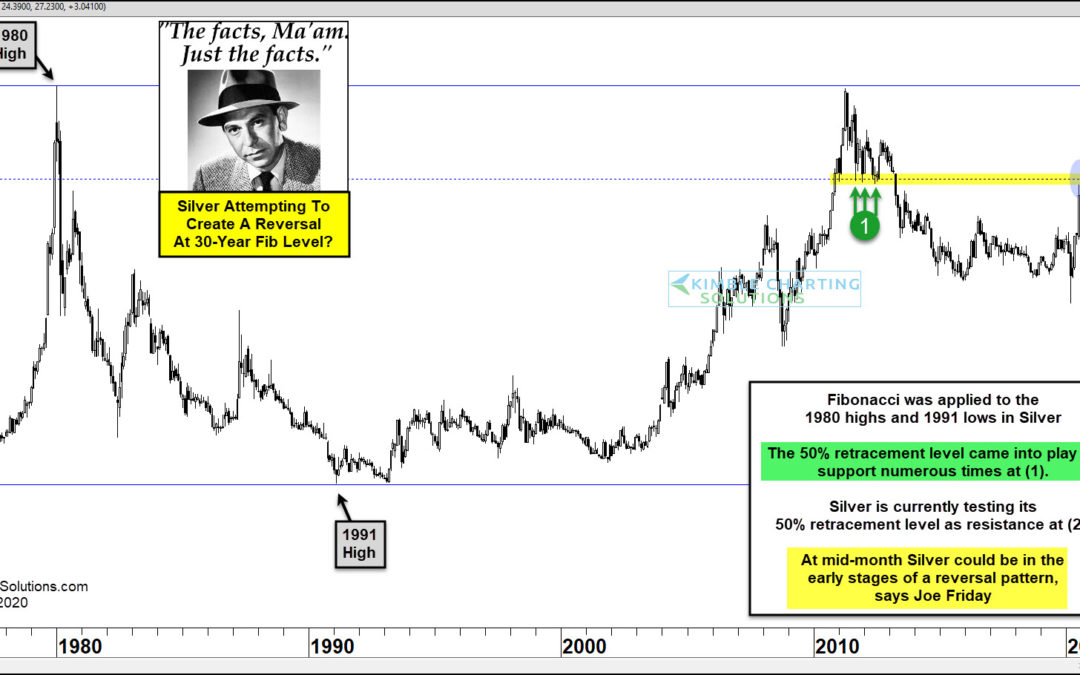
Could Silver prices from 30-years ago be influencing price action this month? Joe Friday suggests it is possible. This chart looks at Silver Futures on a monthly basis over the past 40-years. Fibonacci levels were applied to the 1980 highs ($50) and 1991 lows ($.350)...

by Chris Kimble | Aug 6, 2020 | Kimble Charting
Could Silver be creating a multi-decade bullish “Cup & Handle” pattern? Possible! Did a retest of a handle breakout take place in March at (1), where Silver created one of the largest bullish reversals in decades? Possible! Could Silver be creating a...
by Chris Kimble | Jul 27, 2020 | Kimble Charting
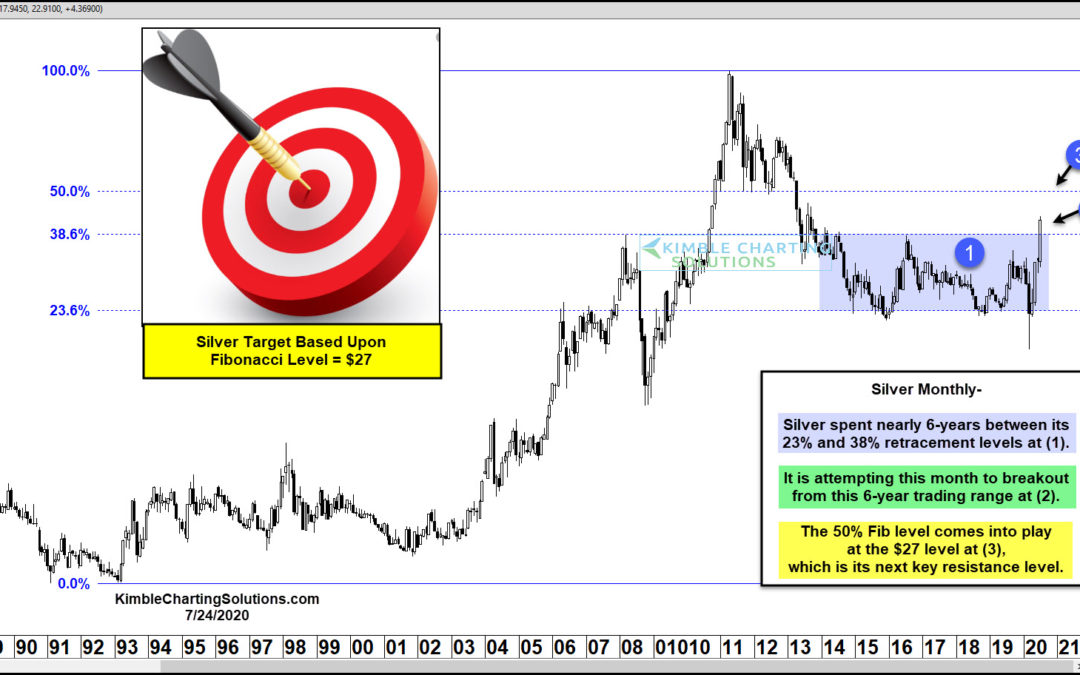
Silver is finally waking up from a long bear market and multi-year slumber. Gold kick-started the precious metals rally and finally Silver is following suit… and perhaps even leading. In today’s chart, we can see that the price of Silver is breaking above a 6-year...

by Chris Kimble | Jul 21, 2020 | Kimble Charting
Precious metals continue to out-perform in 2020 as uncertainty rules the day. Gold took the lead early and rallied sharply… and now Silver is following suit. When Silver joins the party, it tends to add “beta” to the rally, similar to the way the stock market likes...
by Chris Kimble | Jul 21, 2020 | Kimble Charting
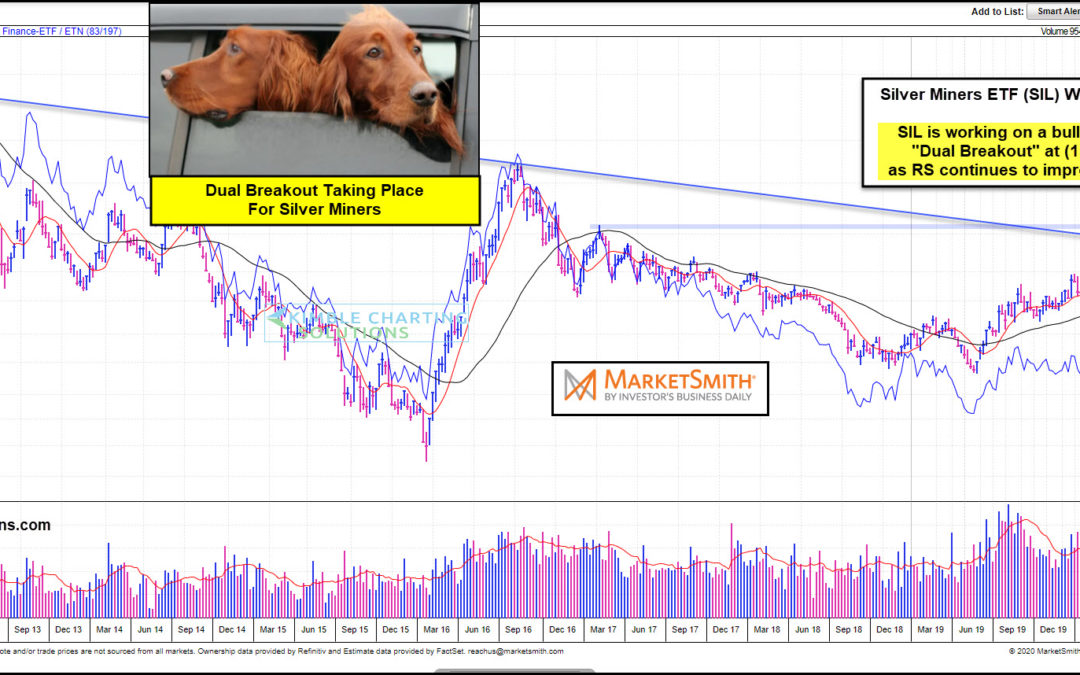
Its been a long struggle to move higher for Silver Miners ETF (SIL) as it has created a series of lower highs since 2012. Is the long-term trend for this ETF about to change? An important move is taking place of late! This chart from Marketsmith.com reflects that SIL...
by Chris Kimble | May 18, 2020 | Kimble Charting
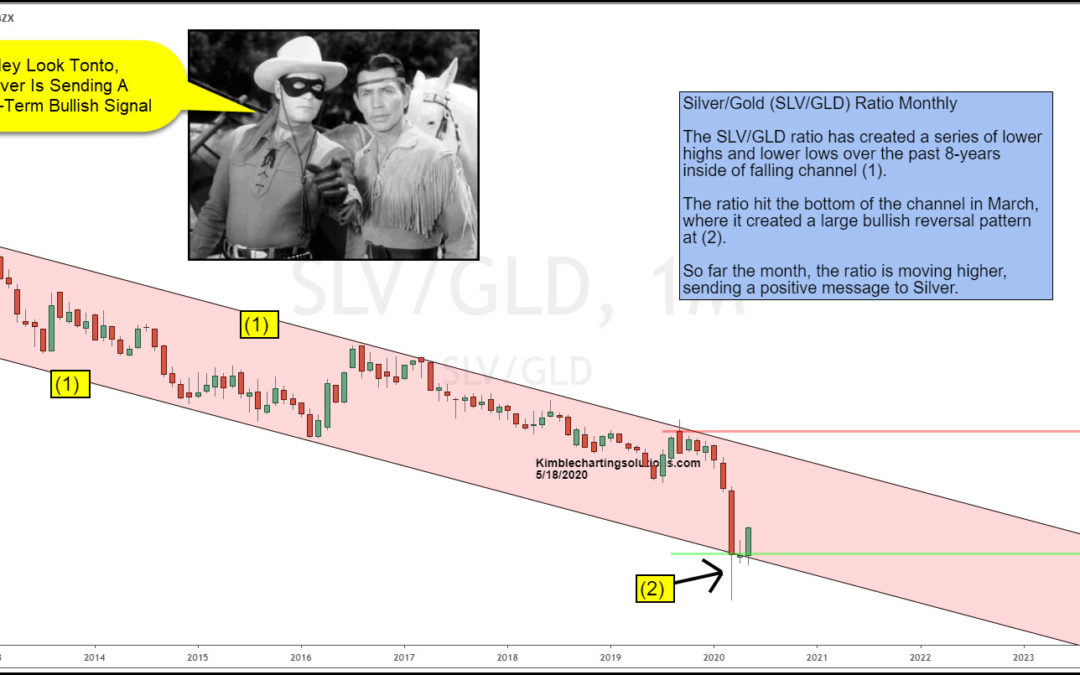
Silver has been much weaker than Gold over the past 8-years! Is that trend about to change? Possible! This chart looks at the Silver ETF & Gold ETF (SLV/GLD) ratio on a monthly basis over the past 8-years. No doubt the trend for the ratio is lower, as it has...

by Chris Kimble | May 8, 2020 | Kimble Charting
Silver has been much weaker than Gold for the past 9-years. Is that trend about to change? A short-term change is possible, says Joe Friday! This chart compares the price of Silver to Gold over the past decade. At the 2011 highs, the ratio created a bearish reversal...
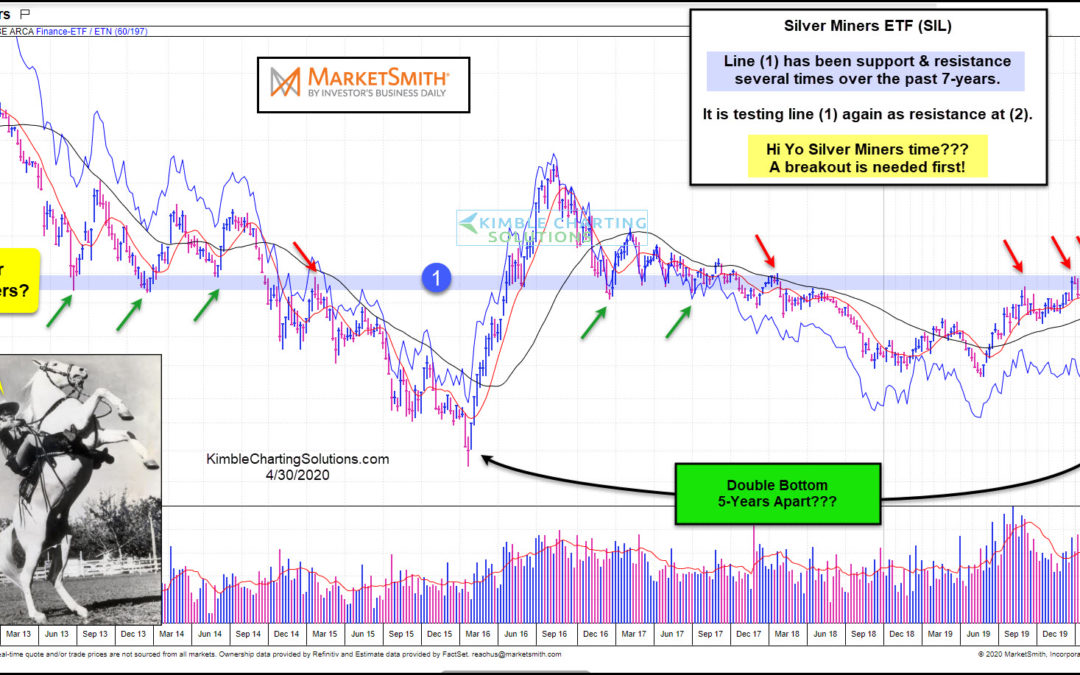
by Chris Kimble | Apr 30, 2020 | Kimble Charting
It is Hi-Yo Silver Miners Time for miners? We could find out real soon, as Silver Miners ETF (SIL) is testing a key breakout level. The sharp decline in March saw SIL test the 2015 lows, creating the potential for a long-term double bottom. This chart from...
