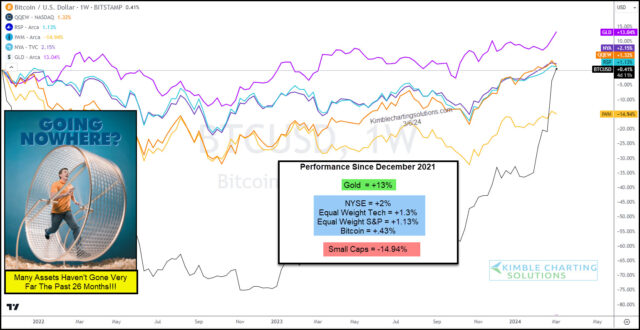
by Chris Kimble | Mar 8, 2024 | Kimble Charting
Several indicators of investor sentiment are showing rising “greed” levels. And when investors get greedy, it tends to imply that we are nearing a top. BUT, I am unsure why greed levels are so high when so many assets have little to brag about over the past few years!...
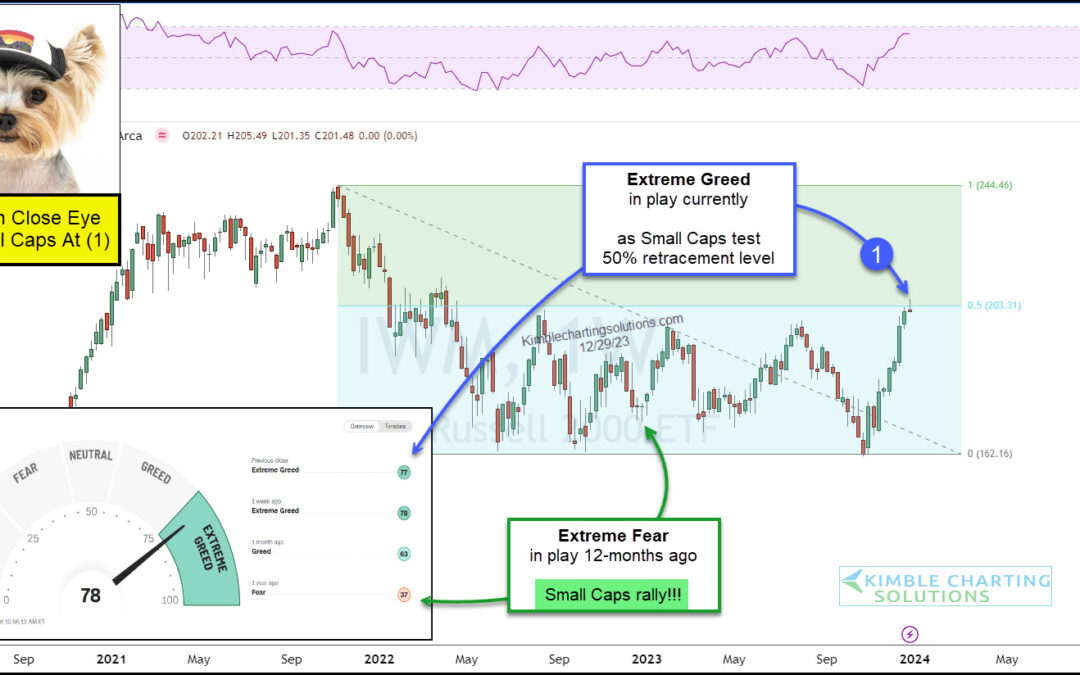
by Chris Kimble | Jan 3, 2024 | Kimble Charting
Small-caps stocks have been a noticeable laggard for over two years. But a recent year-end rally has set the Russell 2000 (IWM) on fire. Will this mark a change in performance in the future? Today’s chart of the Russell 2000 ETF (IWM) highlights its underperformance...
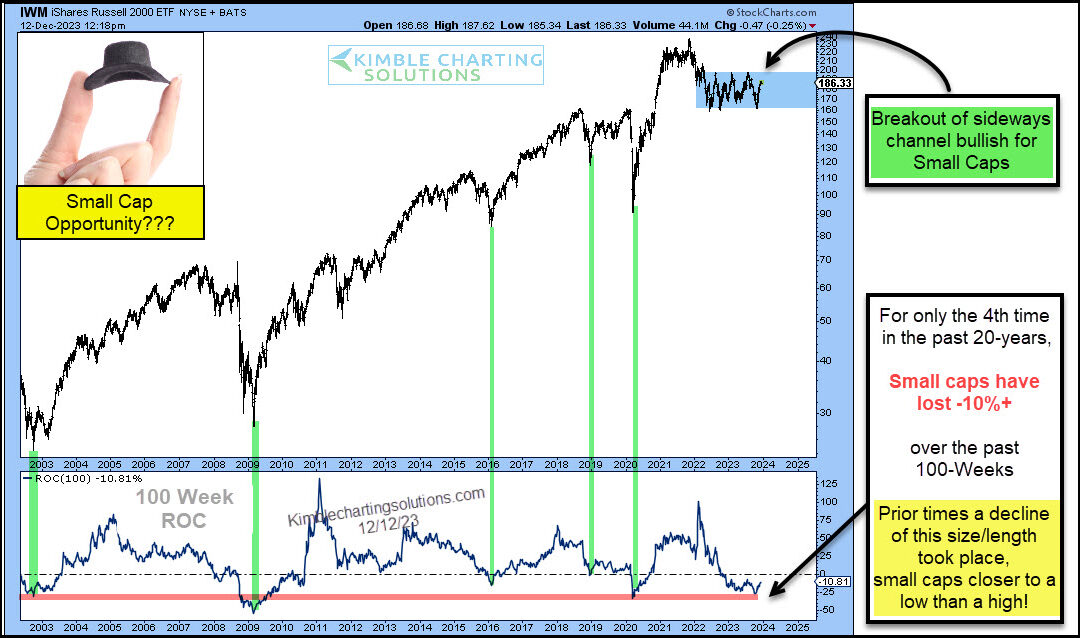
by Chris Kimble | Dec 13, 2023 | Kimble Charting
It is no secret that small-cap stocks have been out of favor. And underperforming! BUT lately, small-cap stocks have been in rally mode. So is there any reason for the recent buying? And could this continue? Today we look at a “weekly” chart of the Russell 2000 ETF...
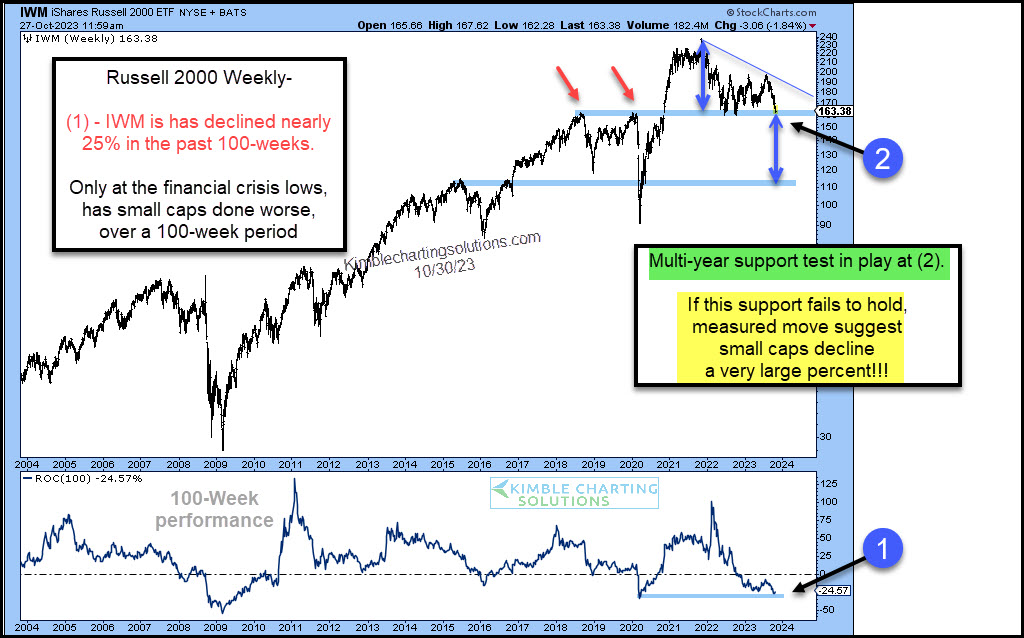
by Chris Kimble | Oct 31, 2023 | Kimble Charting
It’s been a dreadful past couple of years for the Russell 2000 and small cap stocks. Only in 2009 have small caps performed worse over a 100-week period – point (1) on today’s chart. Above we look at a long-term “weekly” chart to highlight some important technical...
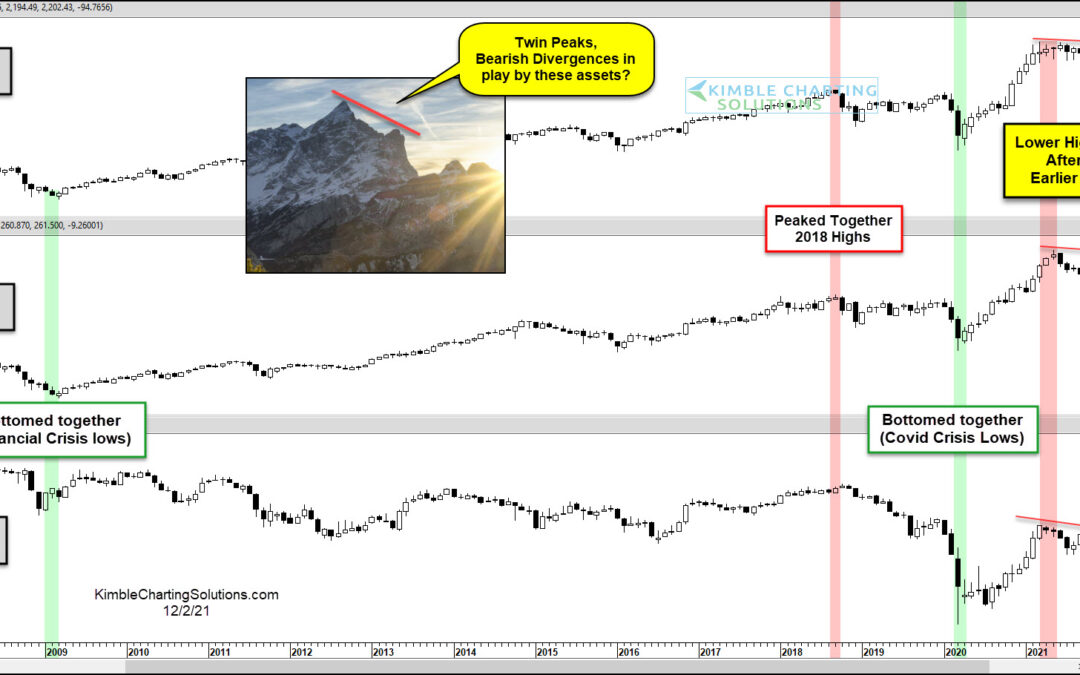
by Chris Kimble | Dec 2, 2021 | Kimble Charting
Uncertainty is mounting as the new omicron covid variant adds to economic concerns like inflation. This week, I shared an article looking at potential topping formations on the Transportation Sector (IYT) and small-cap Russell 2000 Index (IWM). Here we revisit these...
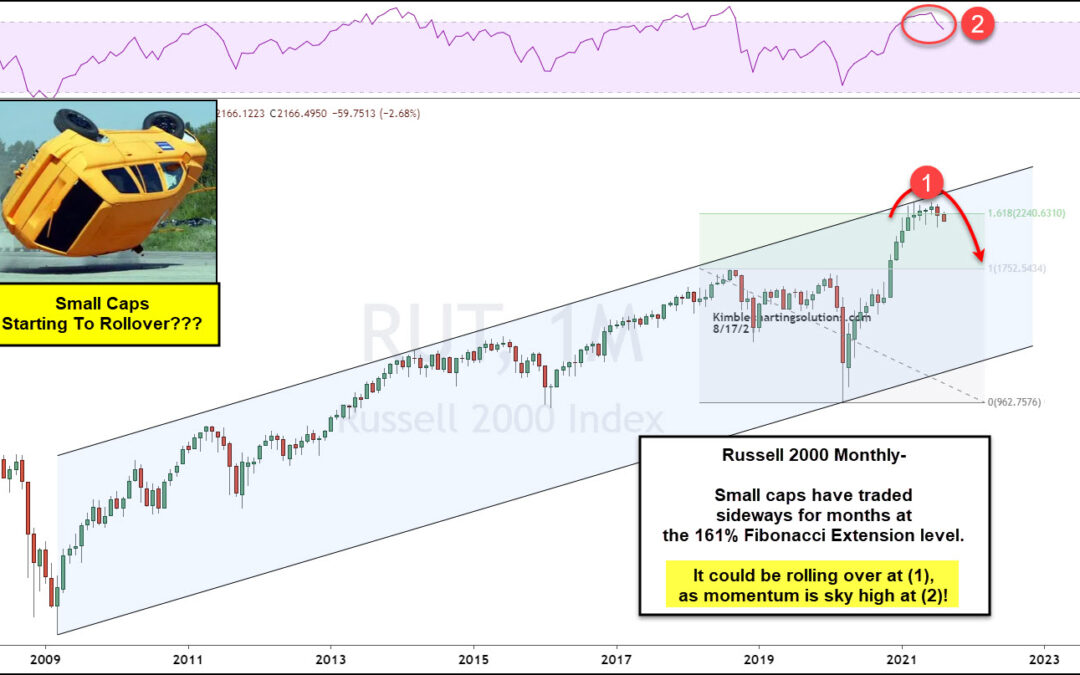
by Chris Kimble | Aug 18, 2021 | Kimble Charting
Small cap stocks spent several months charging higher out of the 2020 coronavirus crash lows. BUT they have also spent the past several months forming a reversal pattern that is beginning to look like a “U-Turn”. Today’s chart looks at the Russell 2000 small cap index...
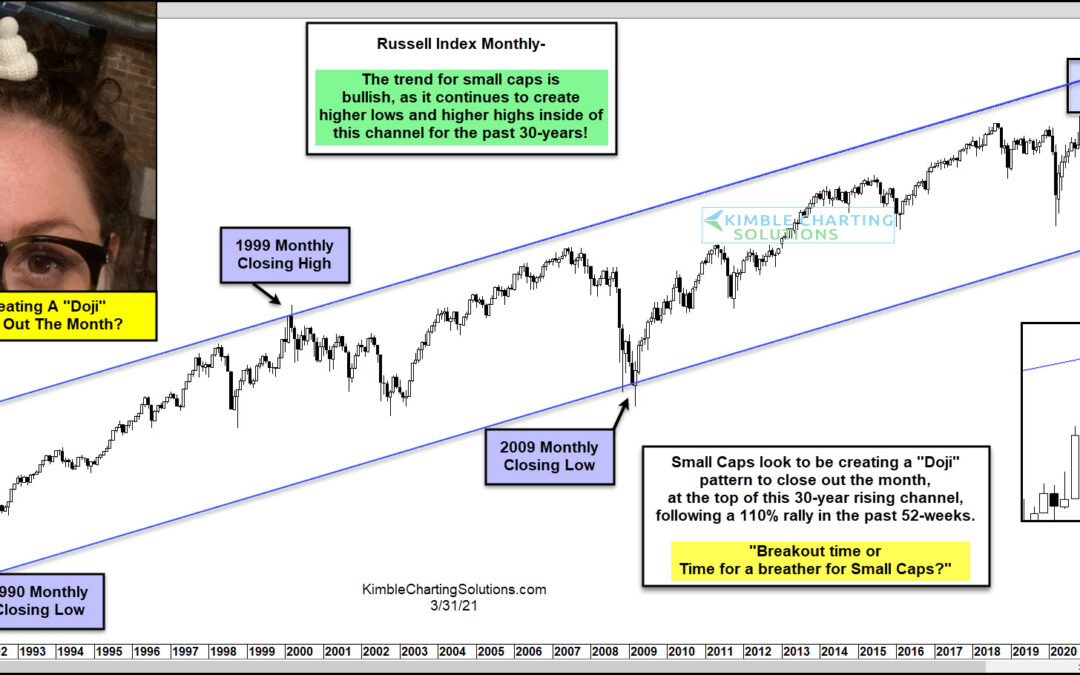
by Chris Kimble | Apr 1, 2021 | Kimble Charting
After months of strong bullish action for the small-cap stock index, the Russell 2000, chart patterns have turned indecisive. The broader trend is still bullish (higher highs and higher lows), but the month of March produced a Doji pattern. And this comes after a 110%...
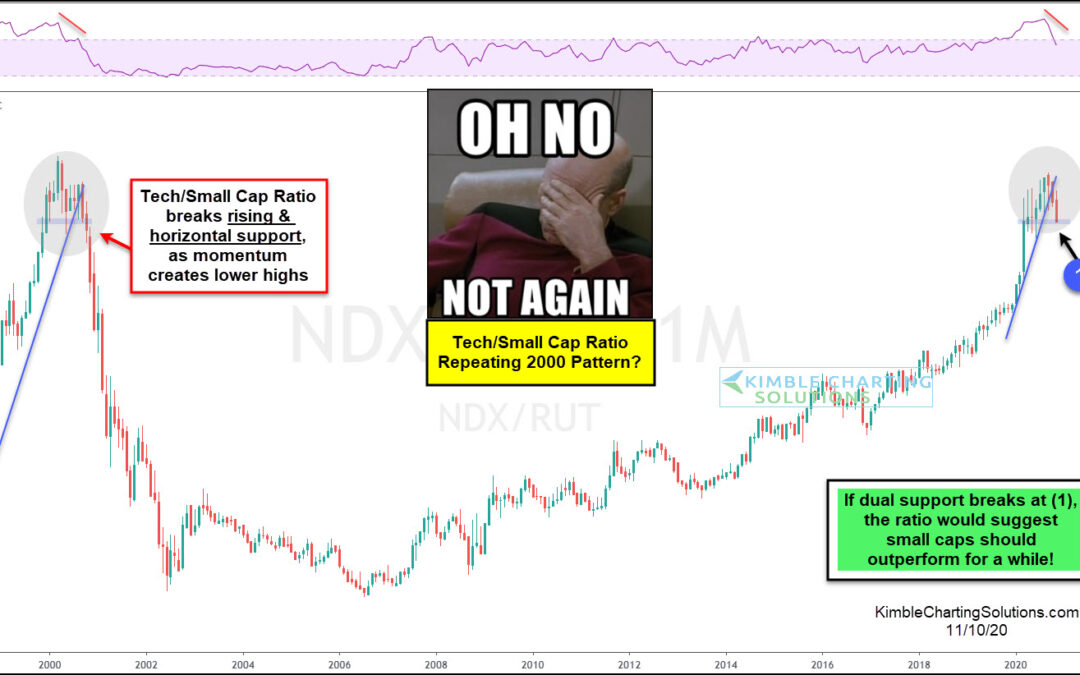
by Chris Kimble | Nov 11, 2020 | Kimble Charting
It’s always good to monitor the performance of market-leading sectors and indices. These leaders provide insight into the health of the bull market, potential trend changes, and/or the trend status of that particular sector or index. Today’s focus is on a long-term...
