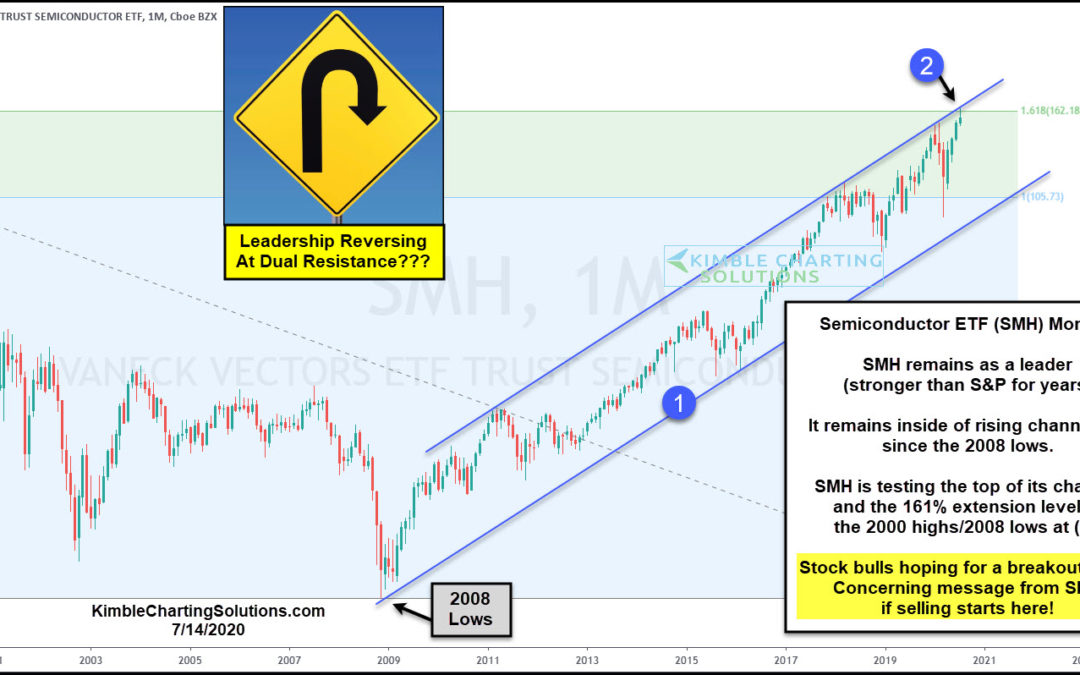
by Chris Kimble | Jul 14, 2020 | Kimble Charting
Is leadership running into a brick wall of resistance and about to pull an important reversal? A strong bullish trend looks to be experiencing an important breakout test! The trend for SMH remains up as it has spent the past 10-years inside of rising channel (1). This...
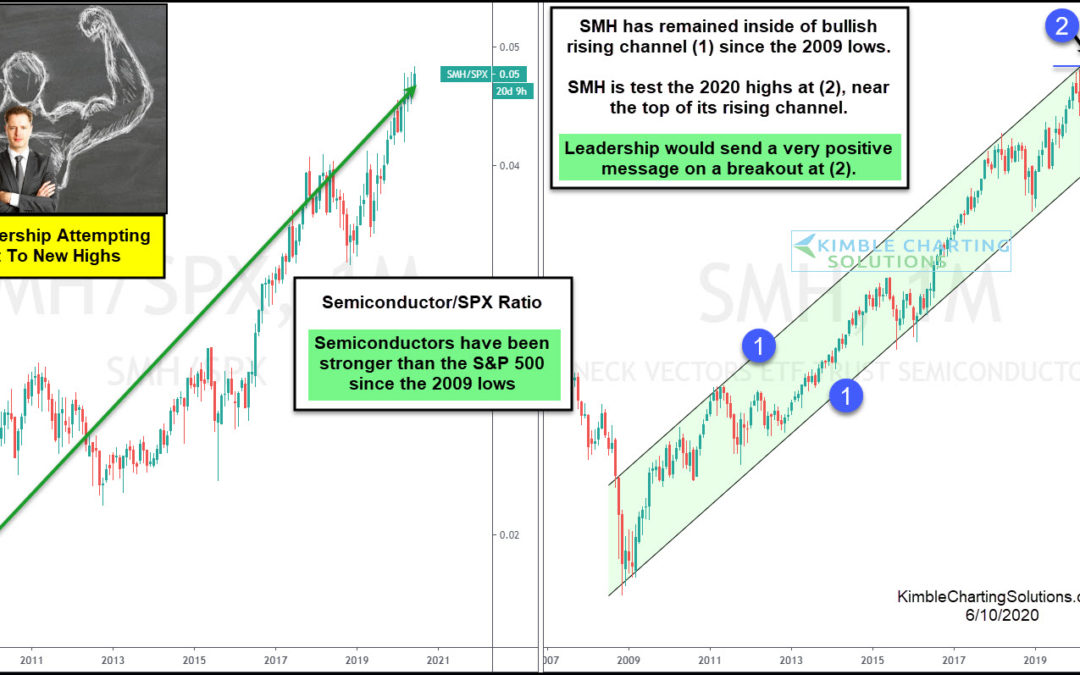
by Chris Kimble | Jun 10, 2020 | Kimble Charting
Strong leadership is attempting to break out to new all-time highs. If it is successful, it sends a positive message to the broad markets! The chart on the left compares Semiconductors (SMH) to the S&P 500 over the past 12-years. Since the 2009 lows, the ratio has...
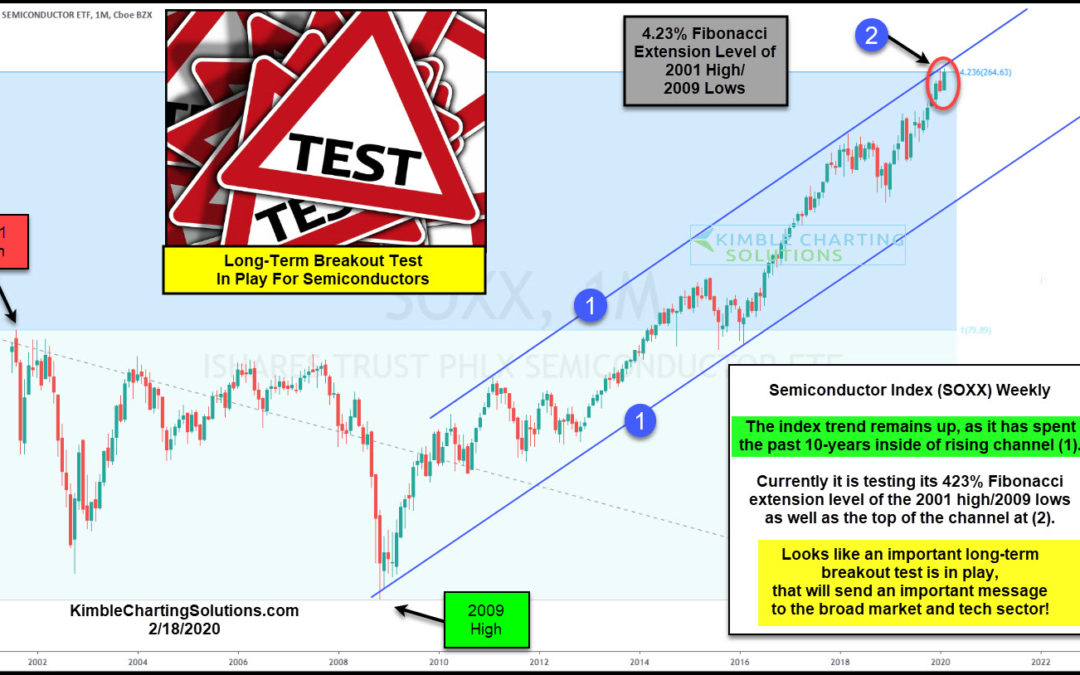
by Chris Kimble | Feb 18, 2020 | Kimble Charting
Since the 2009 lows, Semiconductors have been taken a leadership role as they have far outpaced the gains of the S&P 500. Gains since the 2009 lows; SOXX Index = +821% S&P 500 = +273%. The SOXX index has spent the majority of the past 10-years inside of rising...
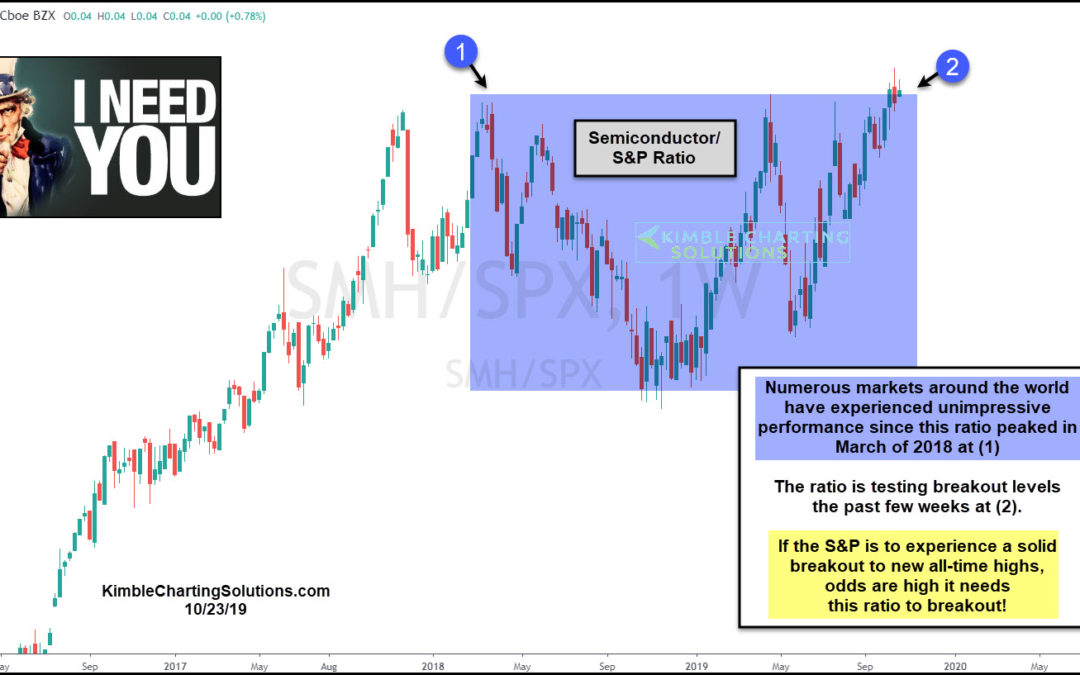
by Chris Kimble | Oct 23, 2019 | Kimble Charting
Is a leading Tech sector about to send the broad market a key message? In our opinion, yes! This chart looks at the Semiconductor/S&P ratio over the past couple of years. When the ratio peaked around March of last year at (1), numerous indices in the states (NYSE,...
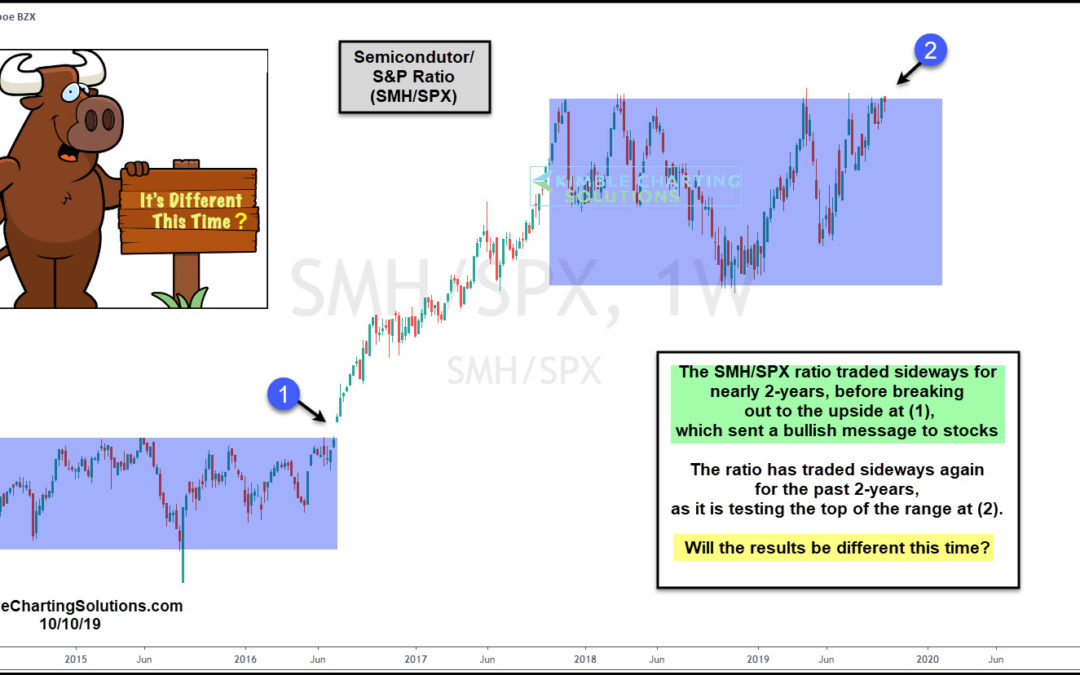
by Chris Kimble | Oct 10, 2019 | Kimble Charting
Sir John Templeton used to say that the four most dangerous words in investing are; “It’s Different This Time.” Investors might want to keep a close eye on this ratio to see if the results will be different this time! This chart looks at the...
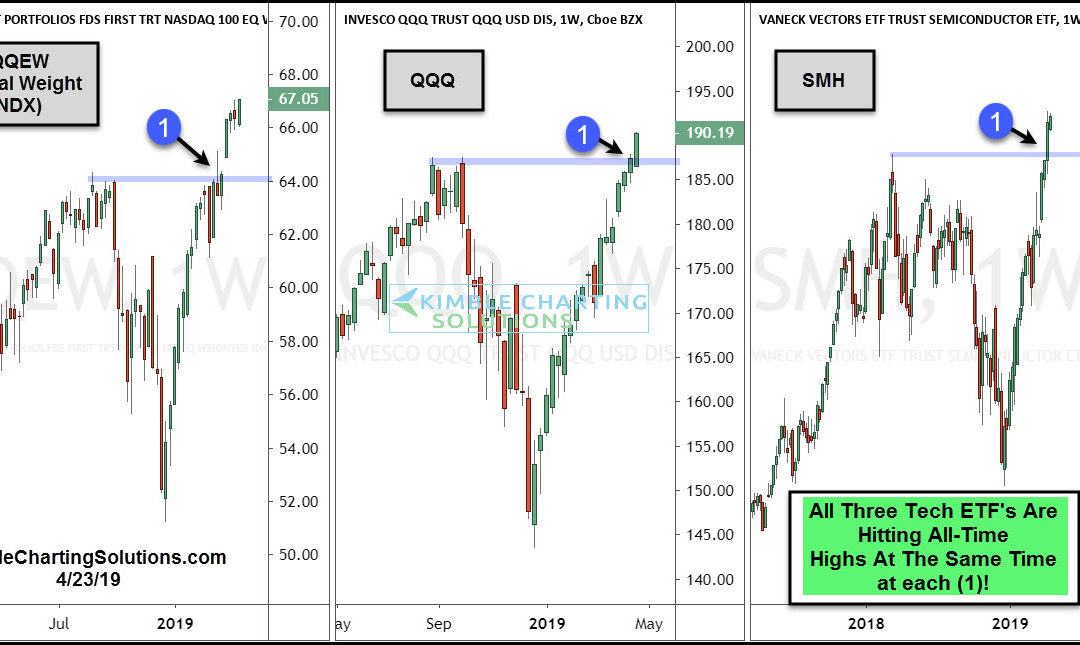
by Chris Kimble | Apr 24, 2019 | Kimble Charting
The stock market rally off the December 2018 lows has been very impressive. In many ways, it’s also been persistent. Every time market bears think they have an opening to drive stocks lower, the major stock market indices surge higher. Though the rally has been...
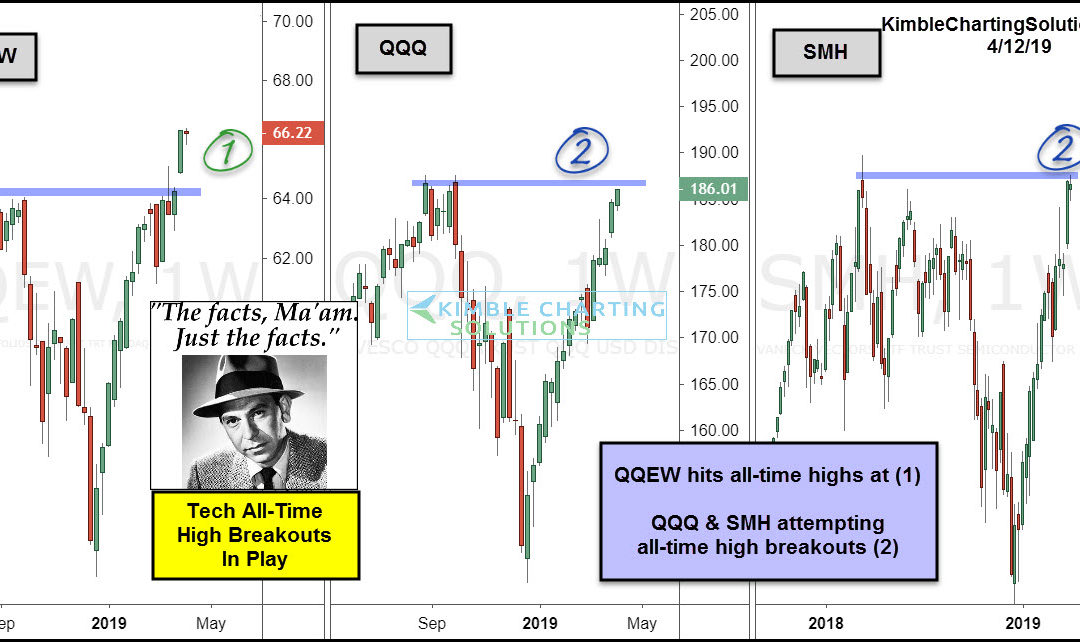
by Chris Kimble | Apr 12, 2019 | Kimble Charting
Is the Tech sector about to send an important bullish message to the broad market? It could today! This 3-pack looks at equal weight NDX 100 ETF (QQEW), the NDX 100 ETF (QQQ) and Semiconductor ETF (SMH) QQEW two weeks ago broke above last years highs, which puts it at...

by Chris Kimble | Mar 27, 2019 | Kimble Charting
After making all-time highs in the year 2000, it took the Semiconductor ETF (SMH) 18 years to revisit those highs. That’s a long lay off! The Semiconductors are a bellwether in the tech sector as well as a leader within the broader stock market. The current rally off...
