
by Chris Kimble | May 20, 2019 | Kimble Charting
The rally off the December stock market lows has been strong, to say the least. The S&P 500 rallied 25 percent before hitting and testing the 2018 high. The old highs proved to be formidable resistance and ushered in some volatility in May… and a 5 percent...
by Chris Kimble | May 15, 2019 | Kimble Charting
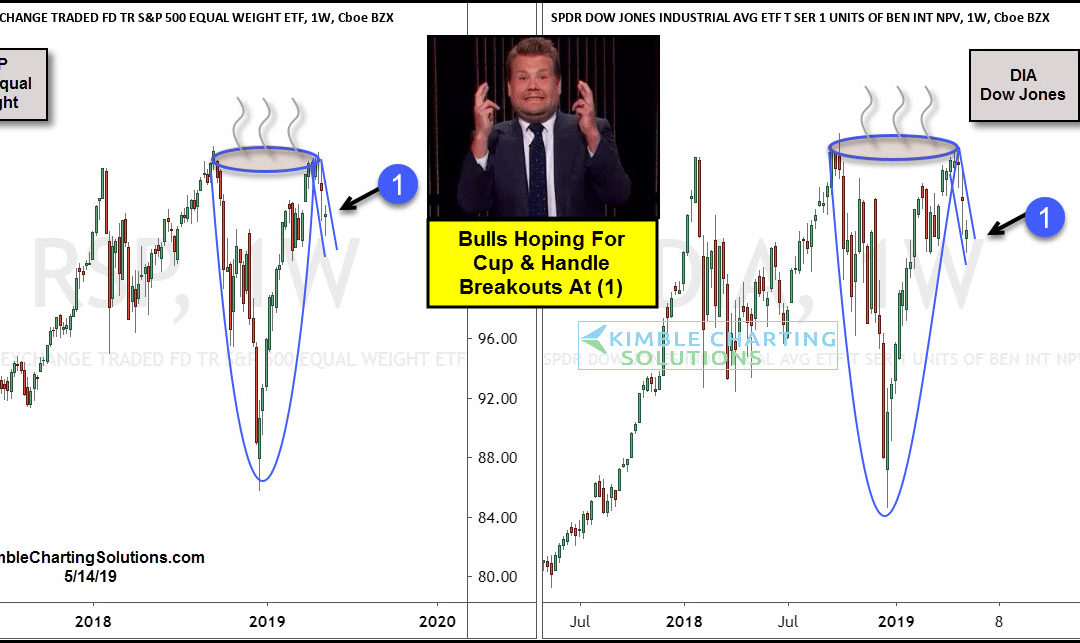
Are the S&P and Dow forming positive “Cup & Handle” patterns over the past 8-months? Bulls sure hope so! A cup and handle price pattern is a technical indicator that resembles a cup and handle where the cup is in the shape of a “U” and...
by Chris Kimble | May 13, 2019 | Kimble Charting
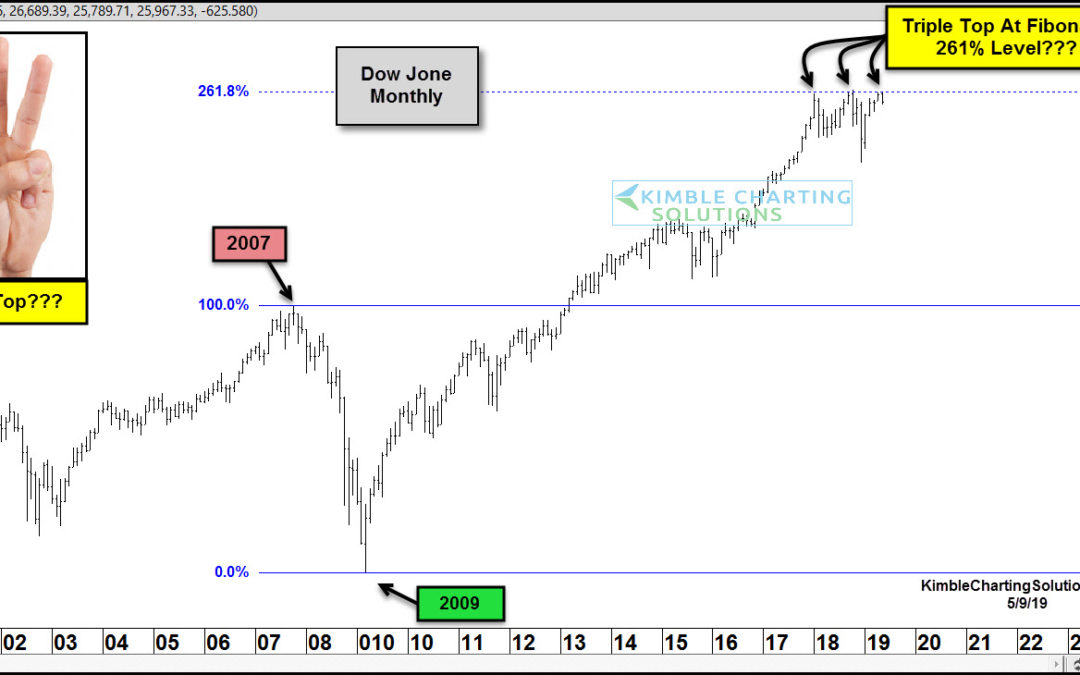
The 4-month stock market rally to start 2019 brought the Dow Jones Industrial Average within 1 percent of its all-time highs made in 2018. This strong move higher has bulls excited about a new bullish wave higher that will lead to new all-time highs. But that cannot...
by Chris Kimble | Apr 26, 2019 | Kimble Charting
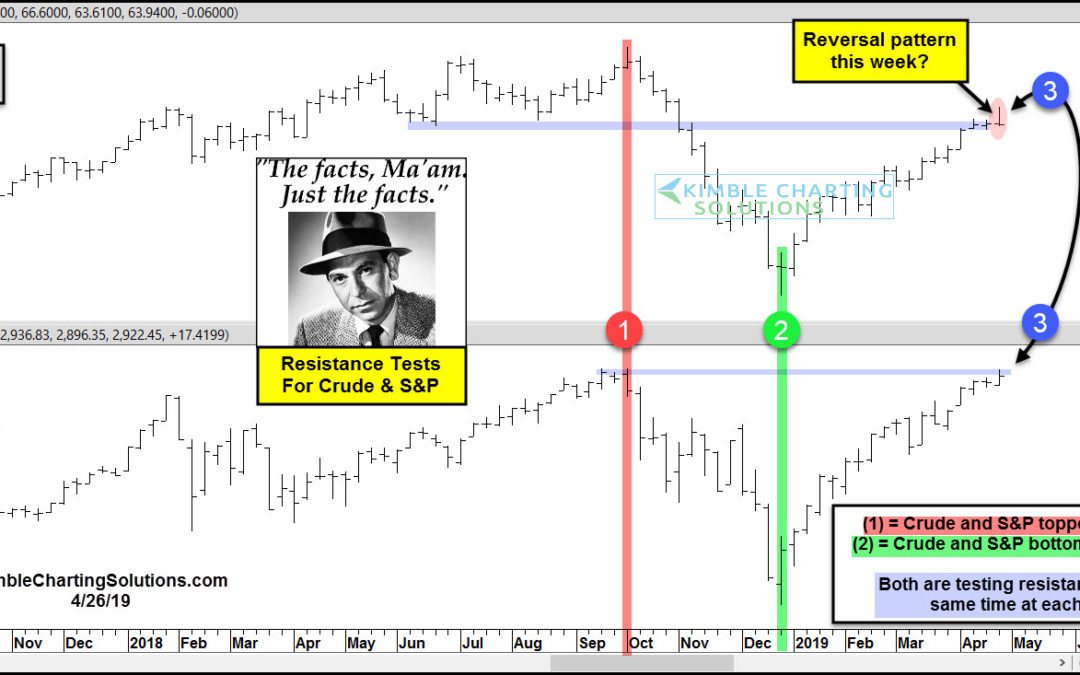
Crude Oil and the S&P 500 peaked last fall together and bottomed at the same time in December. Could they both be peaking together again this week? Joe Friday suggests keeping a close eye on the Crude Oil pattern this week. Crude and the S&P both created...
by Chris Kimble | Apr 22, 2019 | Kimble Charting
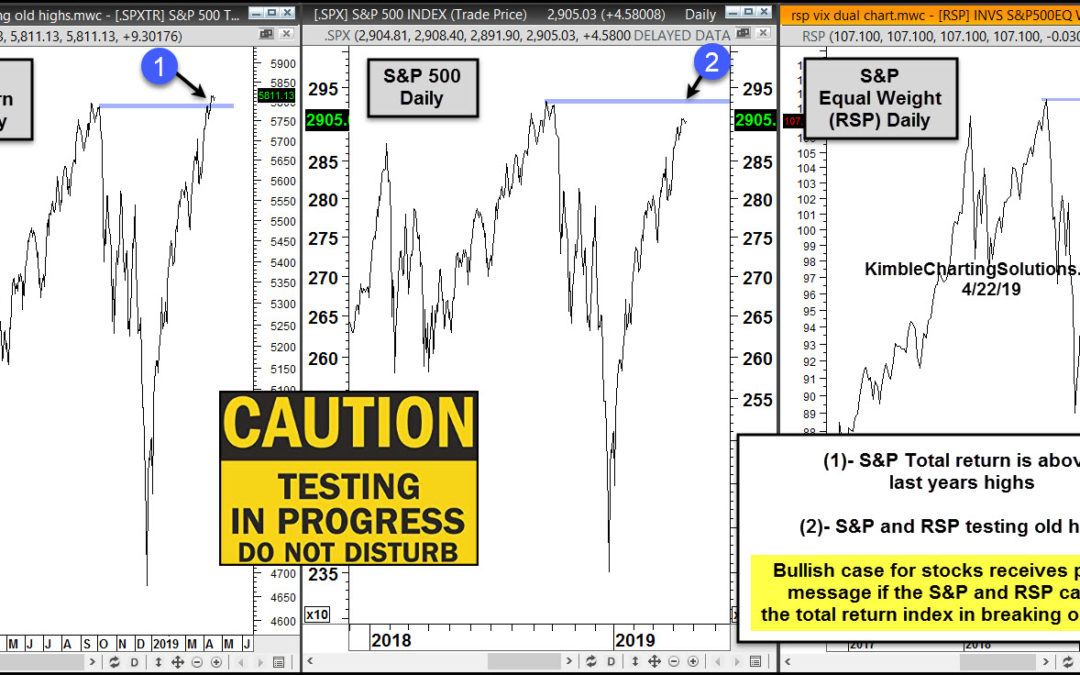
Are all S&P 500 Indices/ETF’s built exactly the same and pattern identical? Nope! This 3-packs looks at the S&P 500 Total return index, the S&P 500 cap weighted index (SPY) and the S&P 500 equal weight ETF (RSP). All three look to be experiencing...
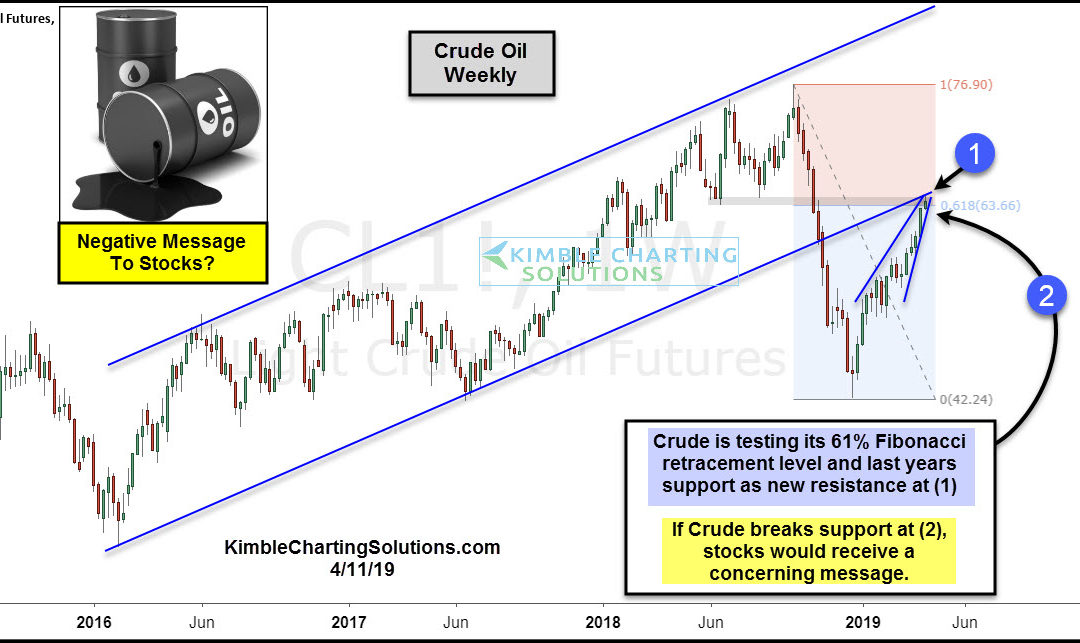
by Chris Kimble | Apr 11, 2019 | Kimble Charting
Crude Oil and the S&P 500 peaked together in September of last year and both bottomed together this past December. Is Crude Oil about to peak and send a bearish message to stocks? A resistance test is in play that could well answer this question. The rally by...
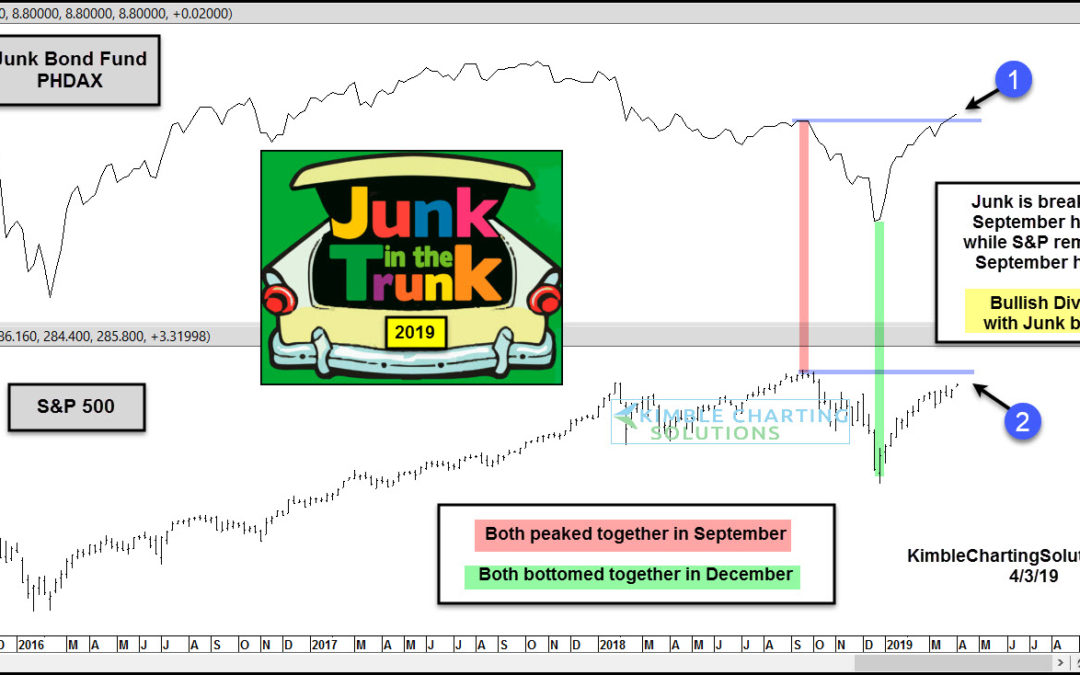
by Chris Kimble | Apr 3, 2019 | Kimble Charting
Are junk bonds sending a rare bullish message to stocks of late? They are giving it a try! This chart compares Pimco Junk Bond Fund (PHDAX) with the S&P 500 over the past few years. Looking back to last fall, Junk Bonds and the S&P 500 both peaked at...
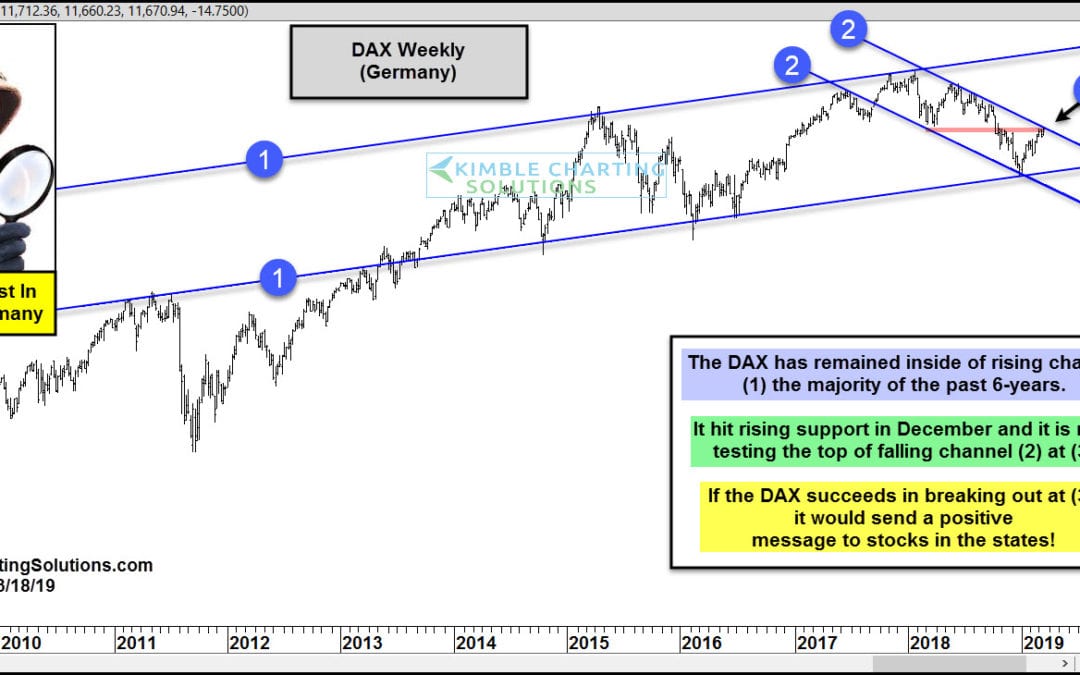
by Chris Kimble | Mar 18, 2019 | Kimble Charting
An important message to stocks in the states will come from Germany in the next few weeks! This chart looks at the DAX index from Germany over the past 10-years. For the majority of the past 6-years, the DAX has remained inside of rising channel (1). The 2018 decline...
