by Chris Kimble | Mar 22, 2022 | Kimble Charting
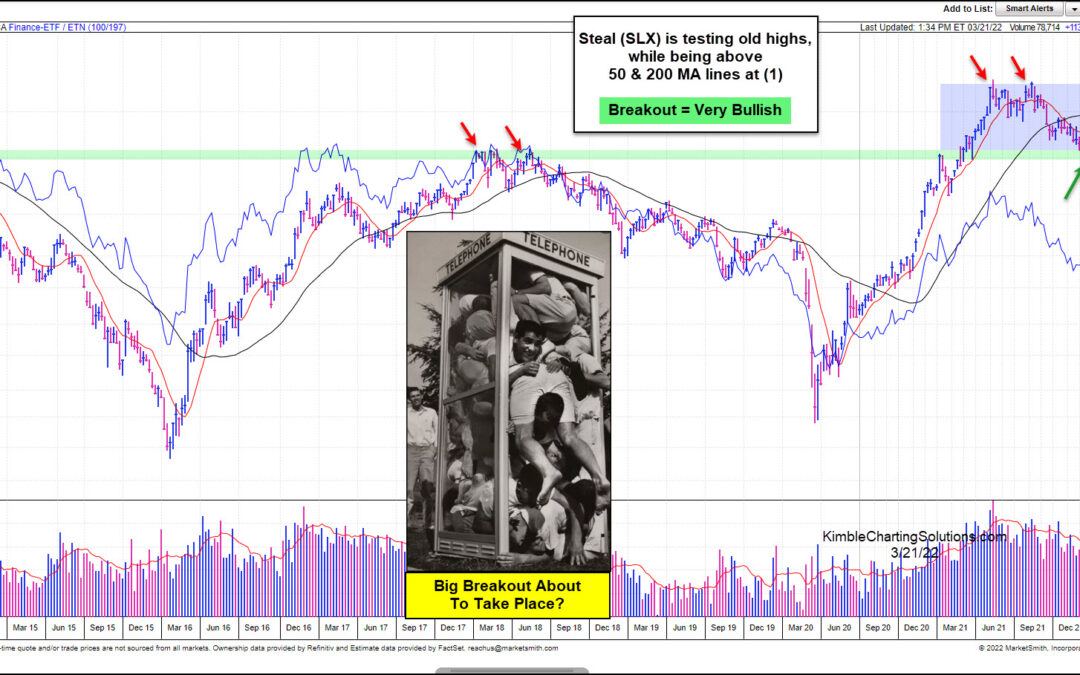
Over the past several months, we’ve shared a lot of commodities charts and highlighted the economic theme of inflation. Well, inflation is here. Now it’s a matter of figuring out if it will get worse. One commodity that is an inflationary indicator is Steel. We...

by Chris Kimble | Dec 6, 2021 | Kimble Charting
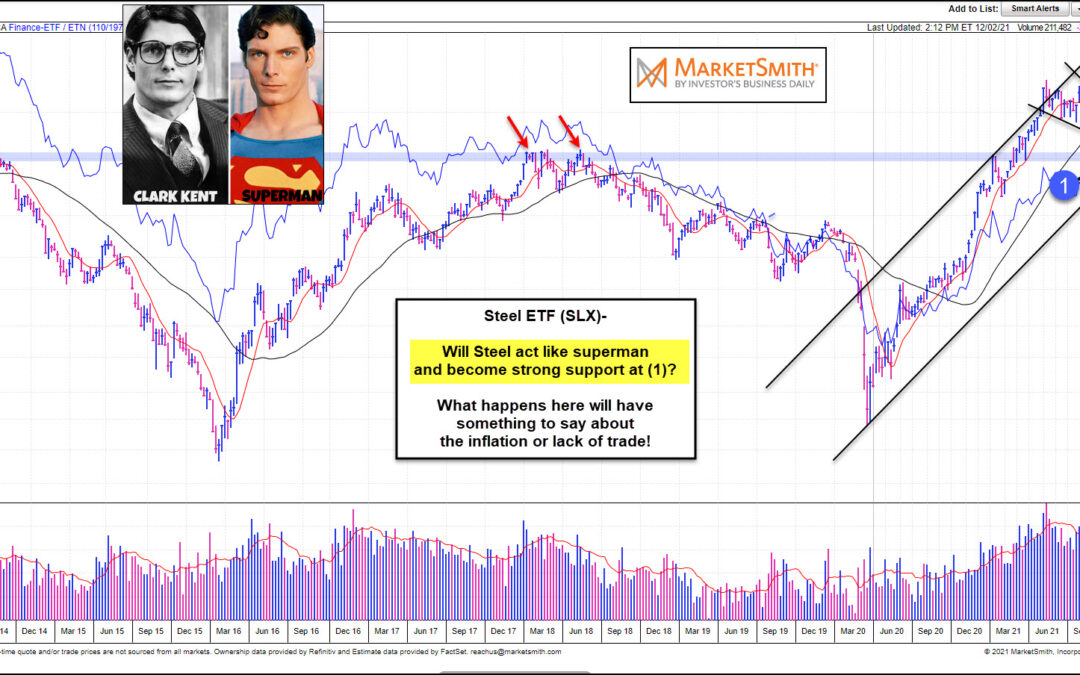
Elevated steel prices have consumers (and investors) concerned about inflation. And whether inflation strengthens or lightens up may depend on the next move in steel prices. After a huge rally out of the coronavirus crash low, steel prices peaked this summer but have...

by Chris Kimble | Jul 28, 2021 | Kimble Charting
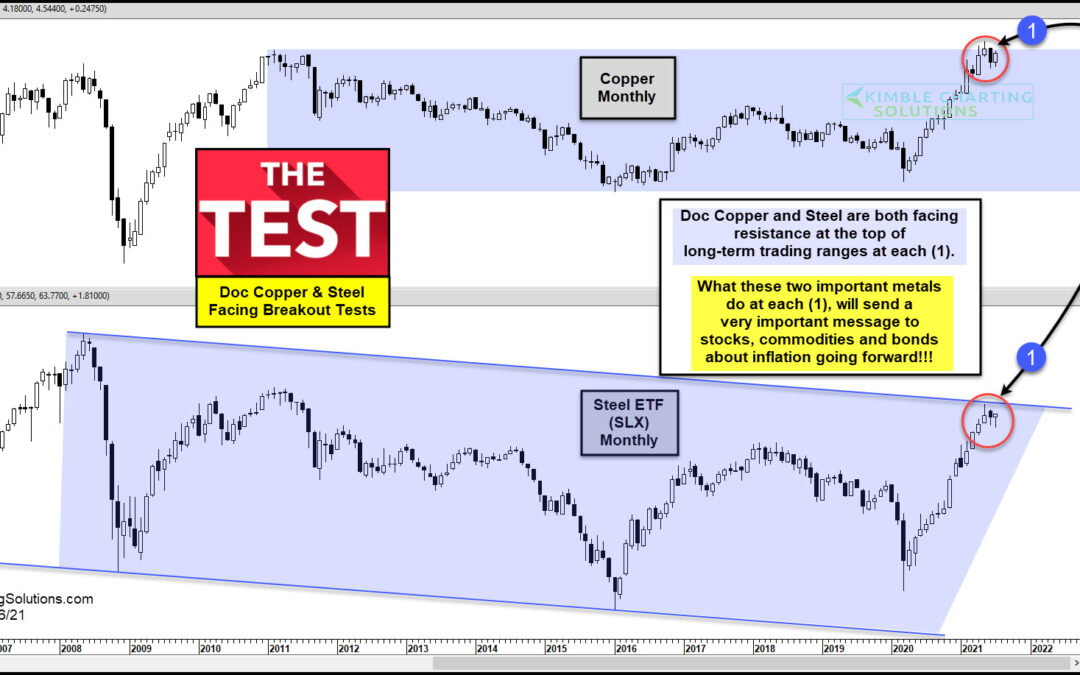
Just as the economic recovery is picking up steam, there are mixed messages coming from inflation data as well as the equities (breadth) and bonds markets (yields). Enter the commodities market… here we can find several key economic inputs that are elevated, and some...

by Chris Kimble | Aug 20, 2019 | Kimble Charting
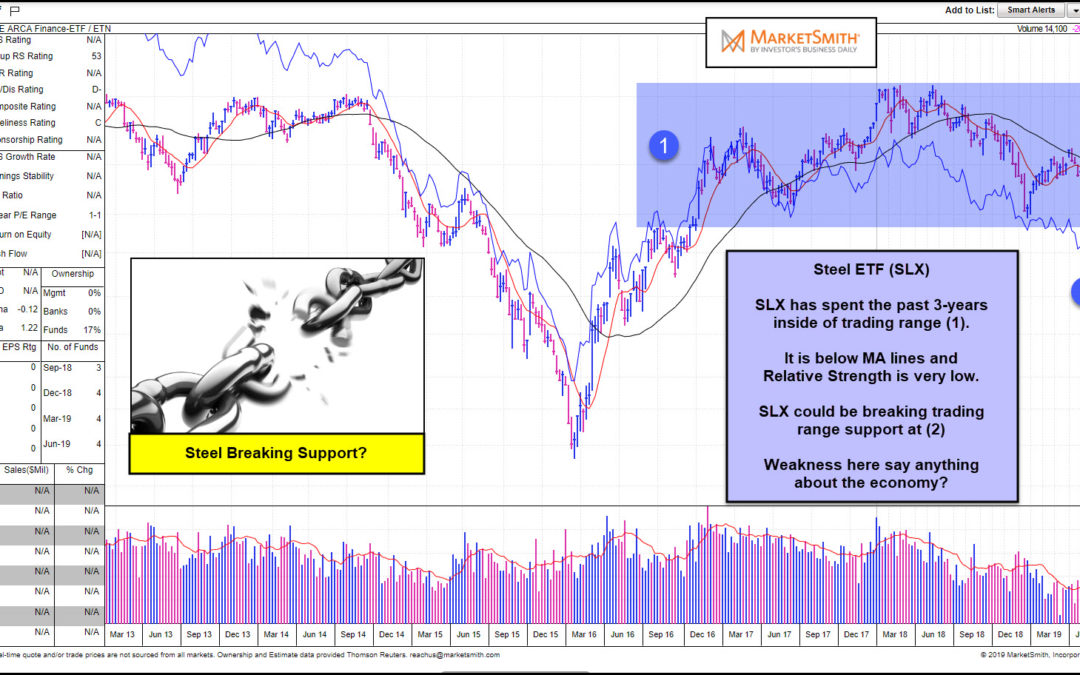
Is the Steel Industry suggesting that a recession is nearing? In my humble opinion, the jury is still out on this one. This chart from Marketsmith.com takes a look at the patterns of Steel ETF (SLX). SLX has spent the majority of the past 3-years inside of trading...

by Chris Kimble | Feb 13, 2017 | Kimble Charting
Below looks at Steel ETF (SLX) over the past 10-years. As you can see below, SLX is testing the underside of several resistance levels. CLICK ON CHART TO ENLARGE Should SLX succeed in breaking above this resistance cluster at (1), it should attract buyers. Doc Copper...


