877-721-7217 services@kimblechartingsolutions.com
  • Twitter
  • Twitter
  • Terms of Use
  • Contact
0 Items
Kimble Charting Solutions
  • Blog Sign Up
  • Free Research (Blog)
  • Research Subscriptions
    • Most Popular Research
    • Premium Member Research
    • Weekly Research Reports
  • What We Do
    • What We Do For You
    • Charts Solve These Investing Challenges
    • What You Receive
  • About Us
    • About Us
    • Testimonials
    • Videos
    • As Seen On
  • Login
Select Page
Major stock indices potentially creating bearish patterns in 2018

Major stock indices potentially creating bearish patterns in 2018

by Chris Kimble | Apr 2, 2018 | Kimble Charting

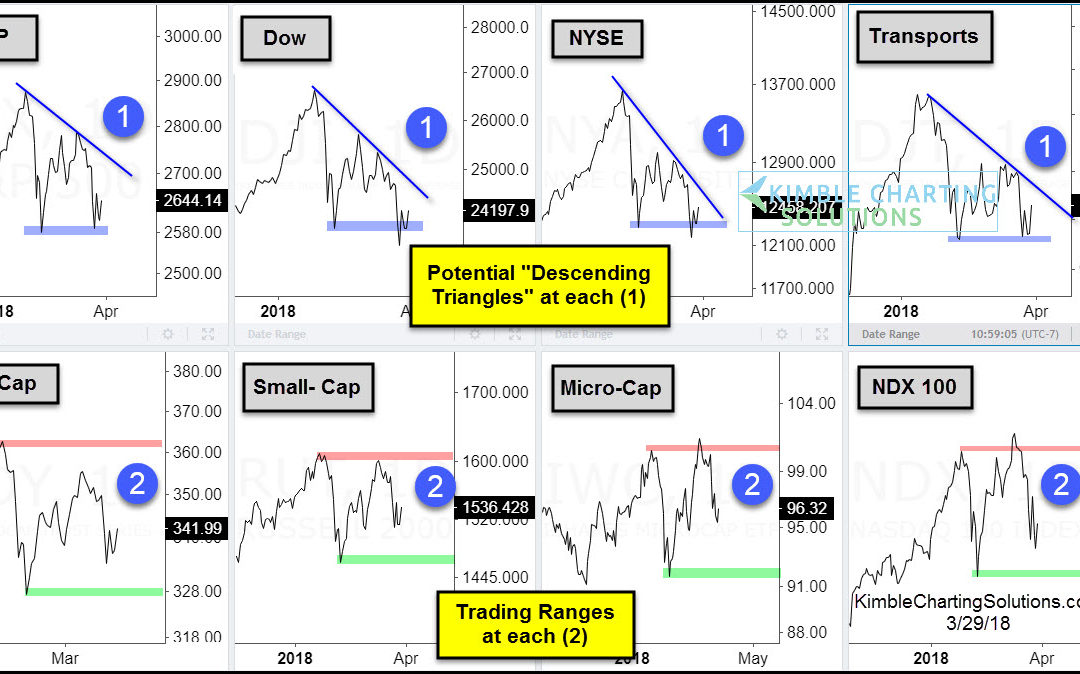
CLICK ON CHART TO ENLARGE The first part of the year got off to a great start, not so much as the first quarter of 2018 came to an end. The above 8-pack looks at numerous indices in the states and highlights the patterns created in the first quarter. First off, from a...
Double Breakout Here Would Be Good News For Bulls

Double Breakout Here Would Be Good News For Bulls

by Chris Kimble | Jul 12, 2017 | Kimble Charting

Over the past several weeks, select cyclical sectors have started to perk up.  From Industrials to Transports to Financials to Materials, all have seen strength. This is good news for investors, as this could signal a fresh leg higher for stocks. Today, I’d like to...

Topic Areas

10-year yield Apple Banks bonds China Commodities Copper CRB Index Crude Oil DAX Doc Copper Dollar Update Dow Jones Emerging Markets Euro GDX gdxj gld gold Gold Bugs Gold Stocks Govt. bonds High Yields Interest Rates Joe Friday Junk Bonds Kimble Charting NASDAQ 100 ndx 100 NYSE Composite QQQ real estate Russell 2000 S&P S&P 500 Shanghai index silver slv SPX spy TLT US dollar What would you do? Wilshire 5000 Yields
  • Terms of Use
  • Contact
  • Twitter

Copyright ©2022 Kimble Charting Solutions. All Rights Reserved | Design by 16Wells