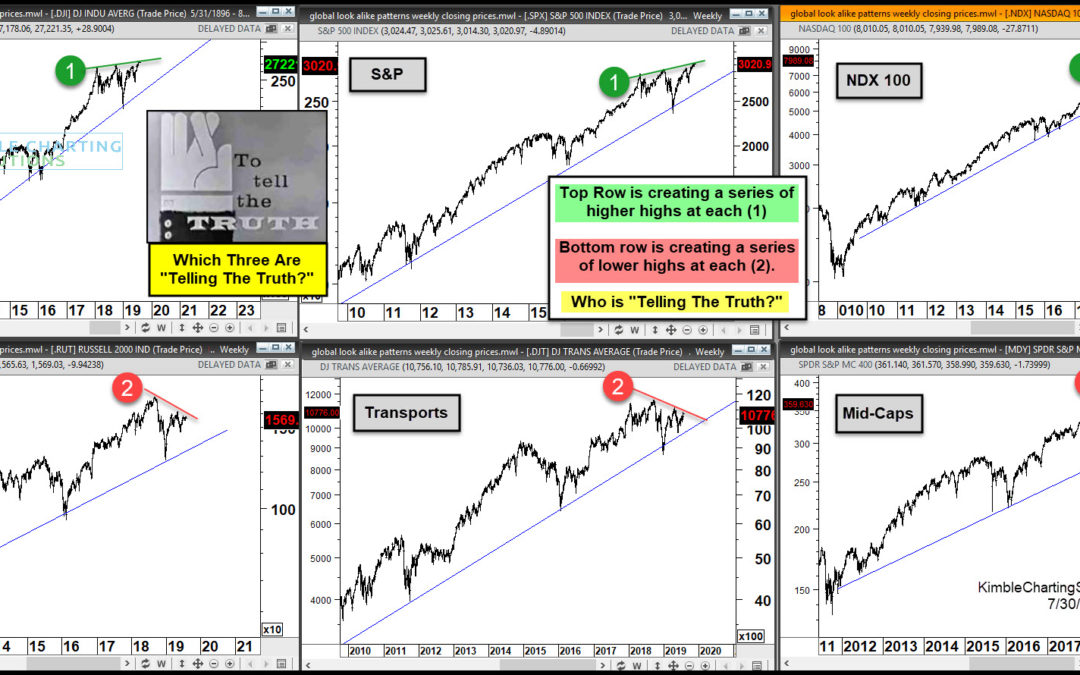
by Chris Kimble | Jul 31, 2019 | Kimble Charting
As investors prepare for the Federal Reserve announcement today, they are feeling pretty good. That’s mostly due to the performance of the “big 3” stock market indexes: the S&P 500 IndexINDEXSP: .INX, Dow Jones IndustrialsINDEXDJX: DJI, and the NasdaqINDEXNASDAQ:...

by Chris Kimble | Feb 13, 2019 | Kimble Charting
Is today the day that four important indices all break above their 200-day moving averages at the same time? Possible! This 4-pack applies 200-day moving averages to the Dow, S&P 500, QQQ and the Transports. The short-term counter-trend rallies since the lows on...
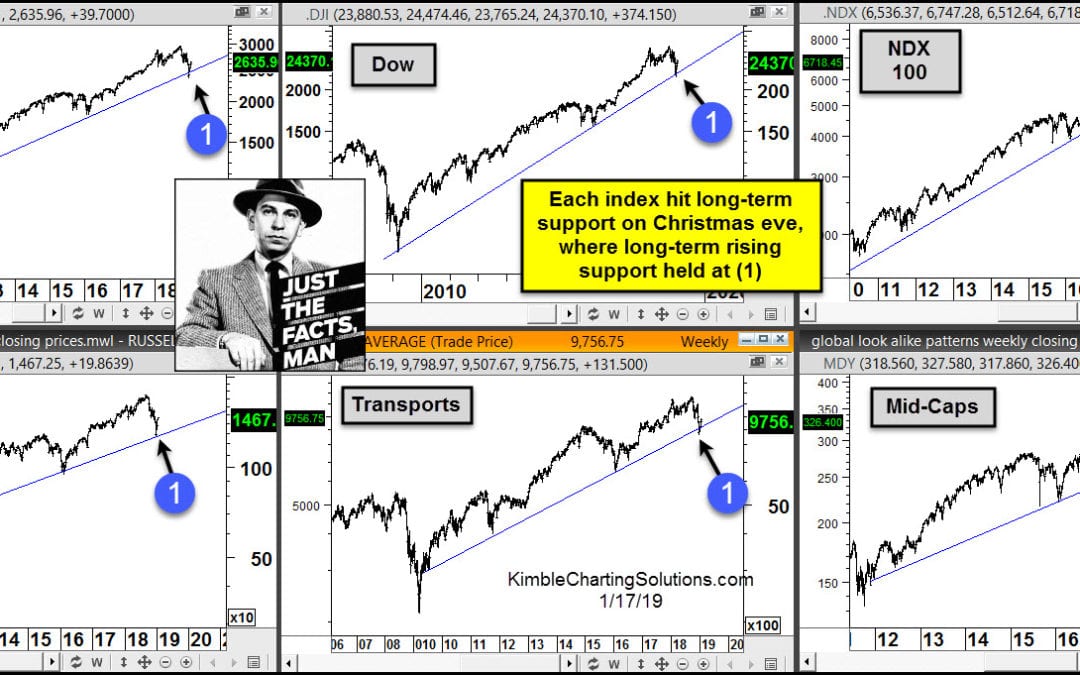
by Chris Kimble | Jan 18, 2019 | Kimble Charting
We often hear “Stocks take an escalator up and an elevator down!” No doubt stocks did experience a swift decline from the September highs to the Christmas eve lows. Looks like the “elevator” part of the phrase came true as 2018 was coming to an...
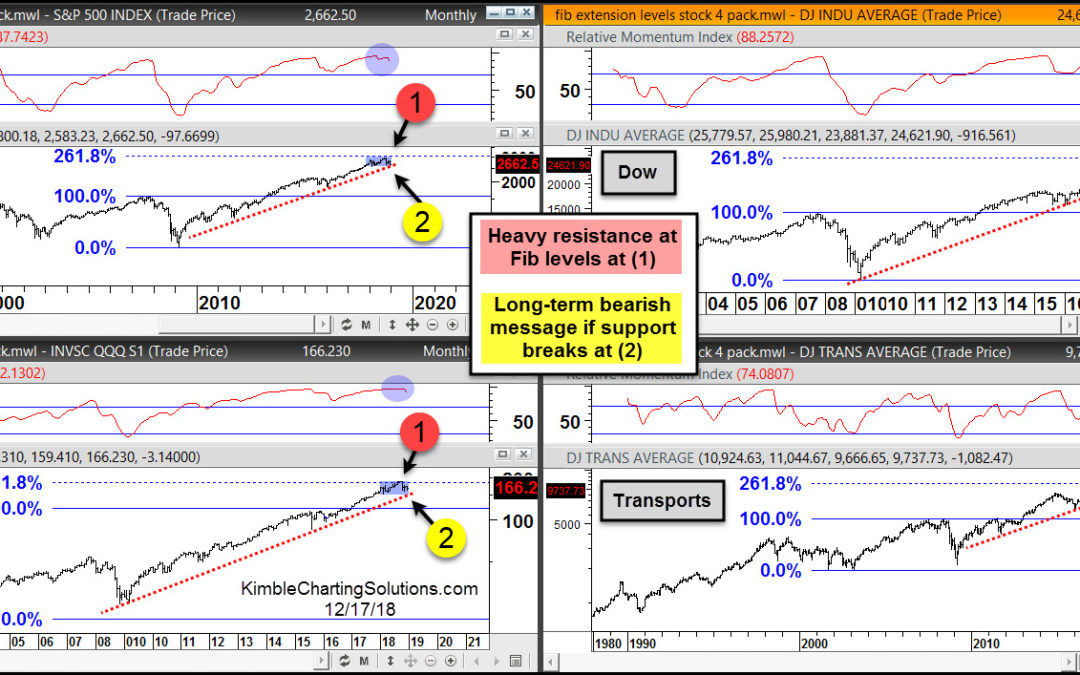
by Chris Kimble | Dec 17, 2018 | Kimble Charting
Even though stocks have been weak of late, breaks of certain price levels could actually trigger much more selling than stocks have seen so far. This 4-pack applies Fibonacci extension levels to the S&P 500, Dow, Nasdaq 100 and Transports. Each of these indices...
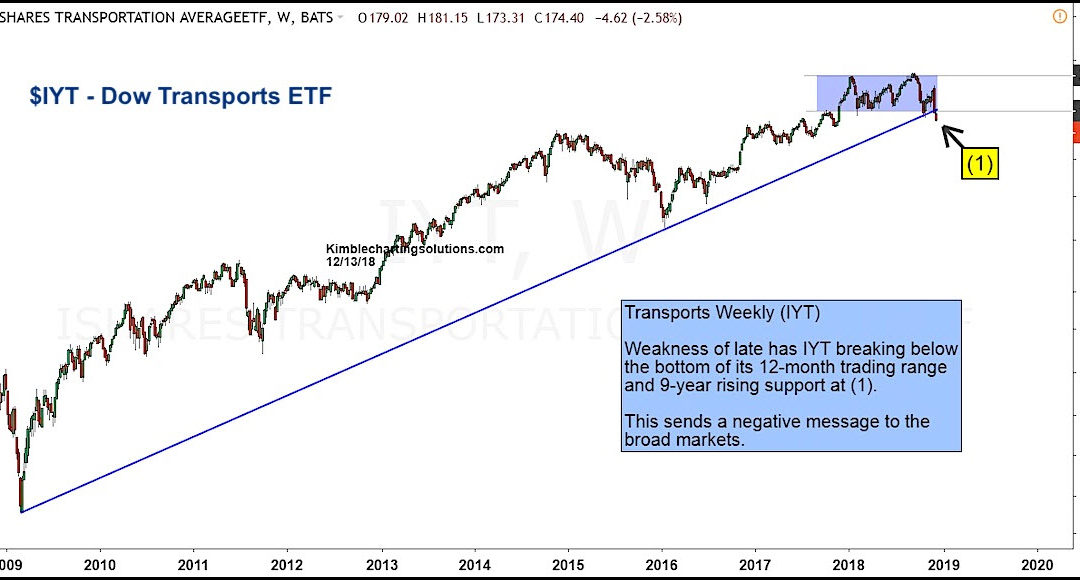
by Chris Kimble | Dec 15, 2018 | Kimble Charting
The bull market is experiencing its first real test since the 2014/2015 stock market correction. Volatility is high and key sectors are heading lower. One such sector is the Transportation Sector(NYSEARCA: IYT) and select stocks. The age-old Dow Theory call for the...
by Chris Kimble | Nov 10, 2018 | Kimble Charting
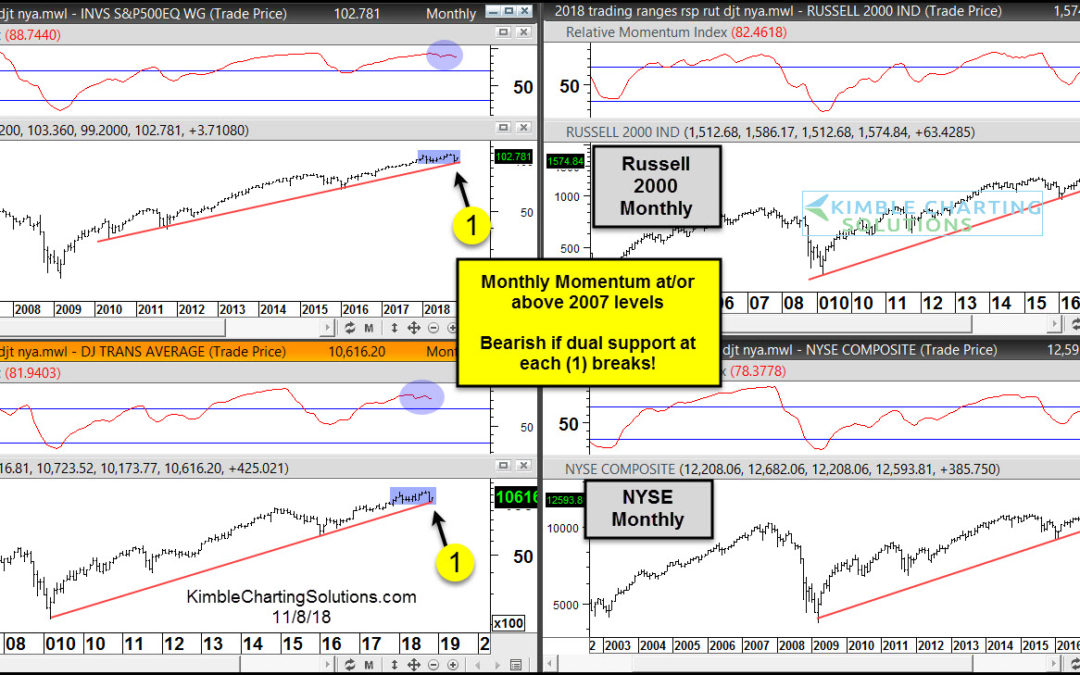
The latest stock market correction and swing lower has seen momentum drop to extreme lows (on a intermediate-term basis). This poses a bit of a conundrum because stocks have been struggling since hitting historic longer-term momentum highs. So what do investors make...
by Chris Kimble | Aug 31, 2018 | Kimble Charting
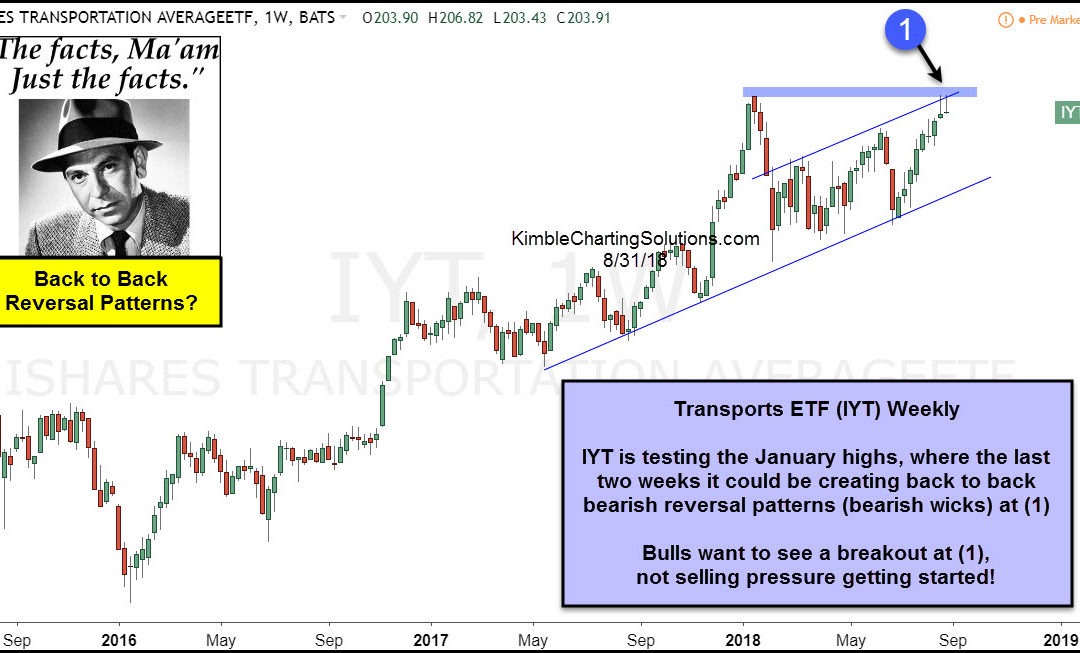
CLICK ON CHART TO ENLARGE The chart looks at Transportation ETF (IYT) on a weekly basis. Its long-term trend remains up and nothing that has changed the trend. IYT peaked in January along with the broad markets and then fell where it tested short-term rising channel...
by Chris Kimble | May 8, 2018 | Kimble Charting
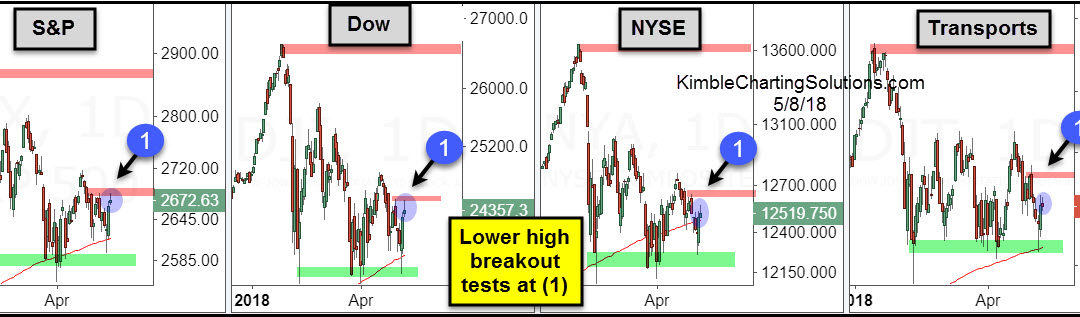
CLICK ON CHART TO ENLARGE This 4-pack looks at a few popular stock indices since the first of this year on a daily basis. Each Index peaked in January, creating the top of the trading range and each bottomed in February, creating the bottom of the trading range. Over...
