by Chris Kimble | Jul 1, 2019 | Kimble Charting
The Gold rally in June was very impressive. Is the bear market in Gold over? Many are of the opinion a major breakout in Gold has taken place. What this indicator does at current levels could go a long way to seeing if the rally in June will continue into July! The...
by Chris Kimble | Jun 26, 2019 | Kimble Charting
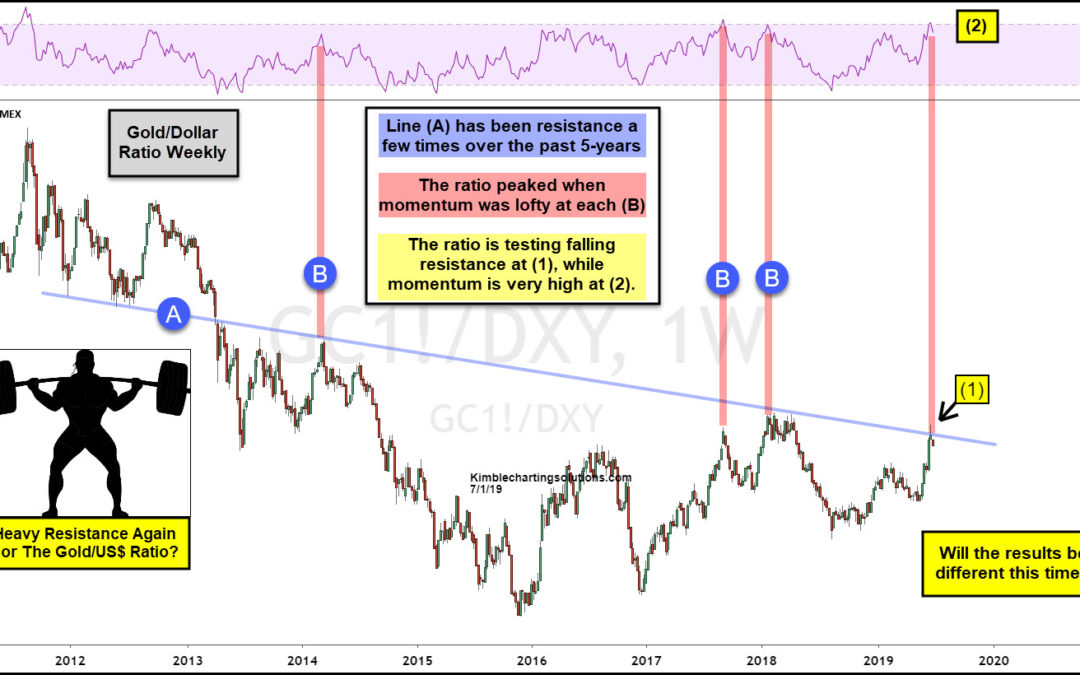
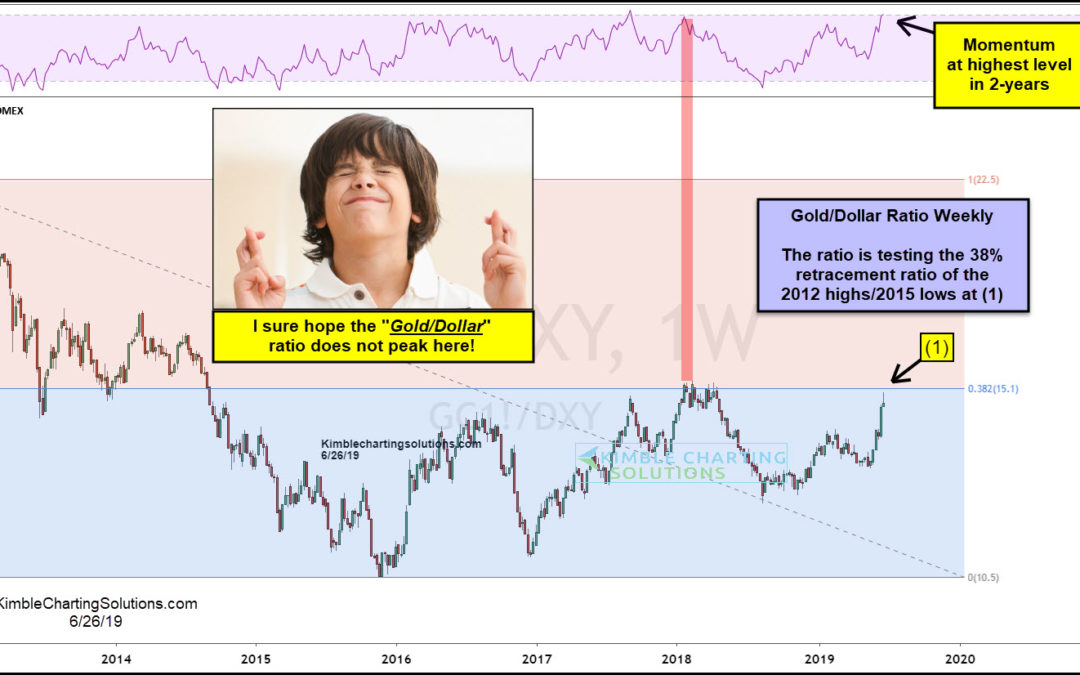
Gold has been strong of late as the US Dollar has been weak. This combo has driven the Gold/Dollar ratio to a key price zone and momentum level, that looks to be important to metals bulls. This chart looks at the Gold/Dollar ratio over the past 6-years. The long-term...

by Chris Kimble | Jun 22, 2019 | Kimble Charting
Gold has been red-hot of late, raising the hopes of precious metals bulls. After several failed rallies, is Gold (NYSEARCA: GLD) finally ready to breakout? One ratio that I like to follow to monitor precious metals is the Gold to US Dollar ratio. As you can see in the...
by Chris Kimble | Jun 7, 2019 | Kimble Charting
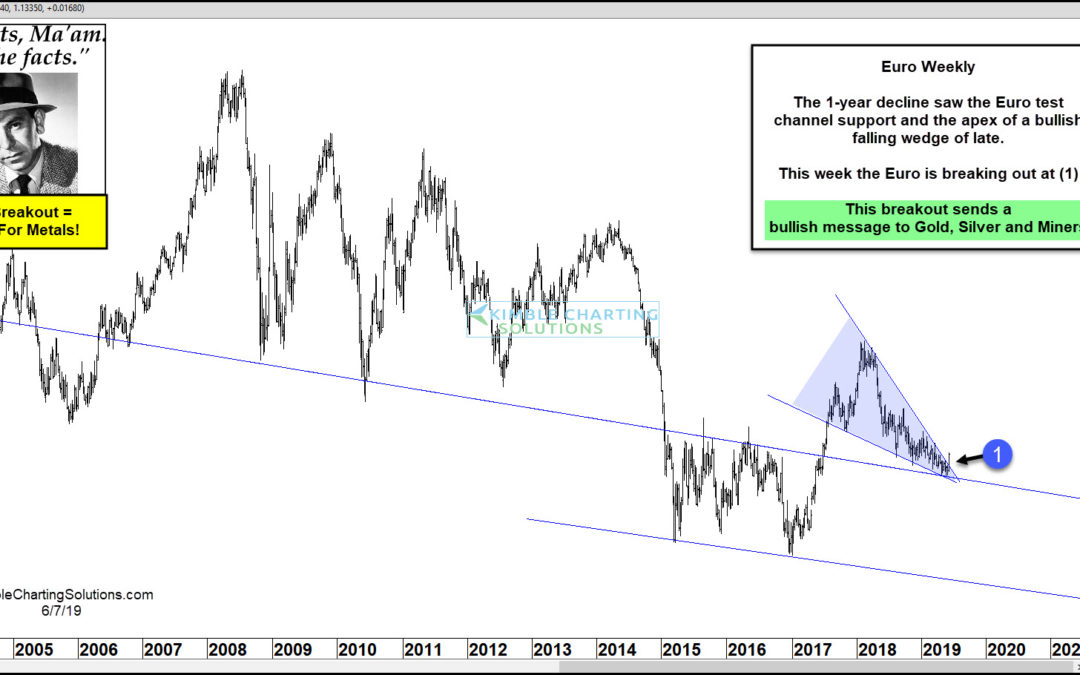
Is the hard-hit Euro about to send a bullish message to Gold, Silver & mining stocks? Looks like it this week! Metals bulls want to see the Euro head higher to send them a bullish message. For the past 14-months, the Euro has created a series of lower highs and...
by Chris Kimble | Jun 4, 2019 | Kimble Charting
The Precious metals industry hasn’t had much to get excited about over the past 5 to 7 years. After peaking in 2011/2012, Gold and Silver prices fell sharply before trading sideways for several years. So it’s been a traders market, with opportunities on both the long...
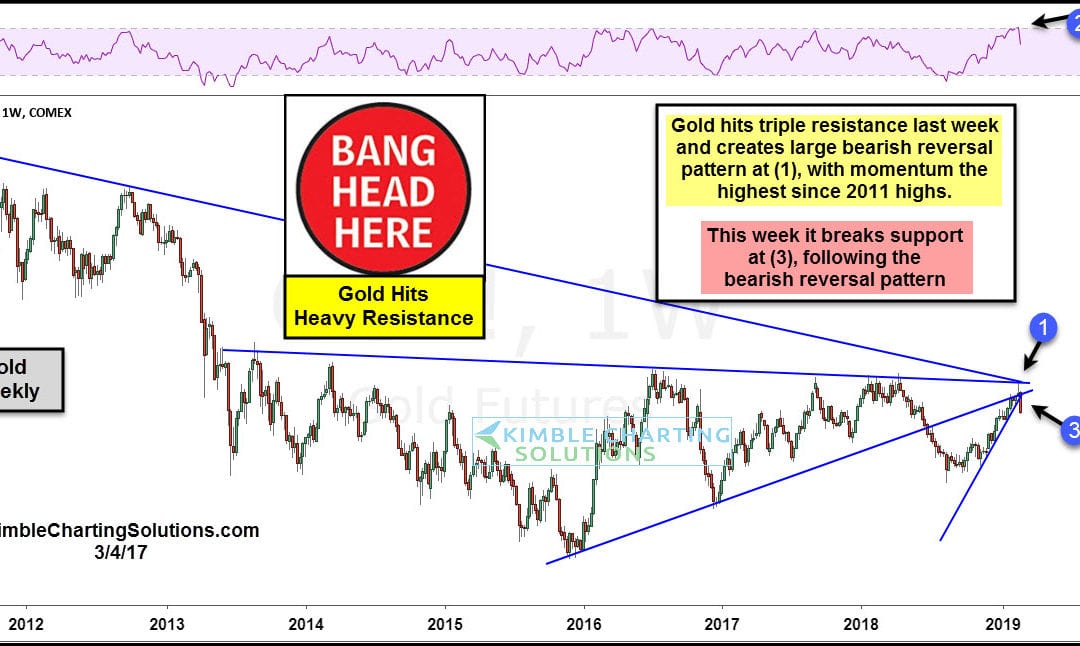
by Chris Kimble | Mar 4, 2019 | Kimble Charting
Precious metals have been a hot topic for investors and the financial markets. Gold, in particular, has caught the eye of market participants. After a 6 month rally into February, Gold futures reversed hard to the downside. This reversal came as gold prices tested...

by Chris Kimble | Feb 8, 2019 | Kimble Charting
Is the nearly 8-year decline in Gold prices coming to an end? That may depend on what Gold does in the days/weeks ahead. Today’s chart highlights the ratio of Gold to the US Dollar. And as you can see, the ratio has been marching higher for several weeks, grabbing the...
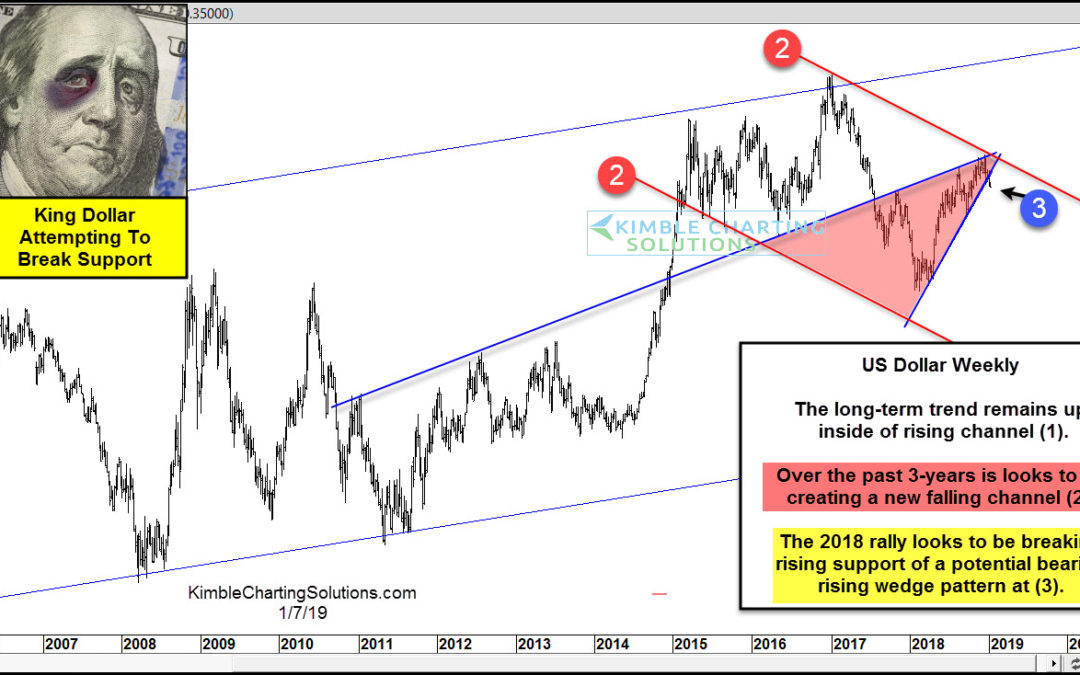
by Chris Kimble | Jan 7, 2019 | Kimble Charting
This chart looks at the US Dollar, reflecting that it has spent the majority of the past 14-years inside of rising channel (1). Over the past 3-years, King Dollar could be creating a series of lower highs and lower lows inside of falling channel (2). It hit the top of...
