by Chris Kimble | Jul 18, 2018 | Kimble Charting
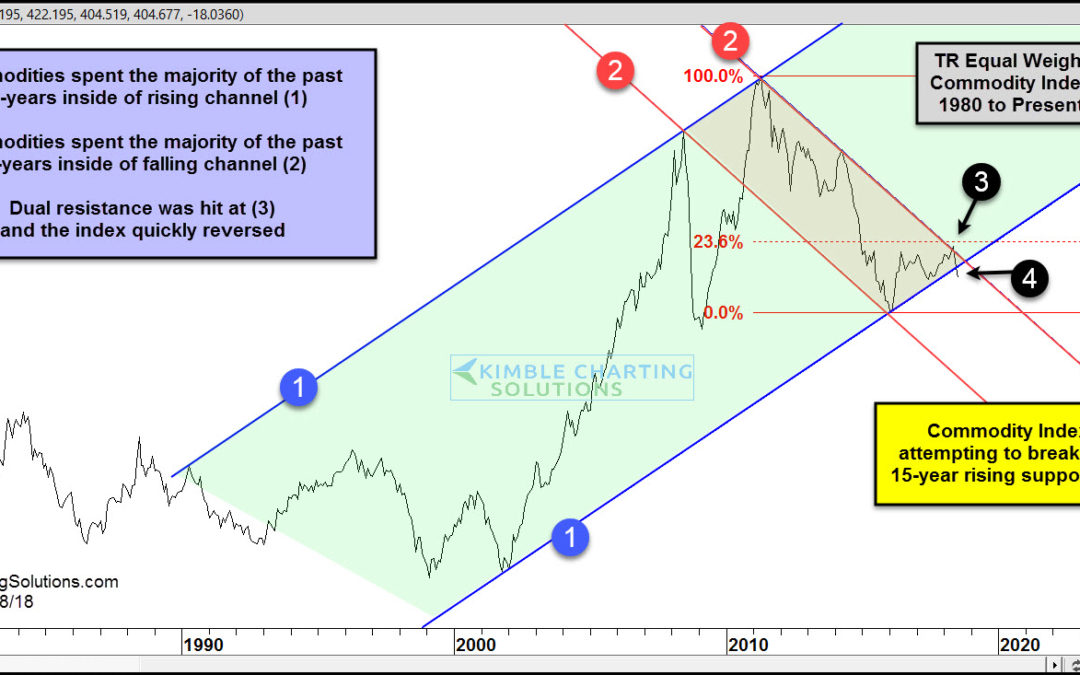
CLICK ON CHART TO ENLARGE The chart looks at the Thomson Reuters Commodity Index over the past 38-years, on a monthly closing basis. The index has been creating a series of higher lows and higher highs over the past 15-years inside of rising channel (1). It hit the...


