by Chris Kimble | Oct 27, 2020 | Kimble Charting
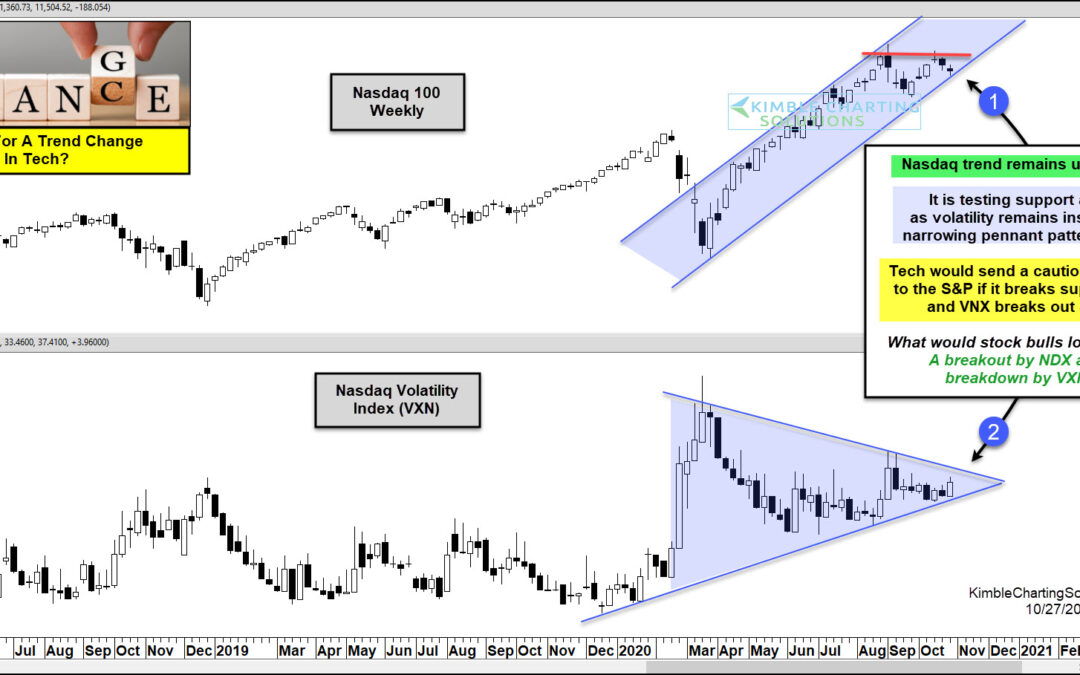
Is the bull trend in tech about to end? What Tech and its volatility index does in the next few weeks will go a long way to answer this question! This chart looks at the NDX 100 and its Volatility Index (VXN) on a weekly basis over the past couple of years. The trend...
by Chris Kimble | Mar 31, 2020 | Kimble Charting
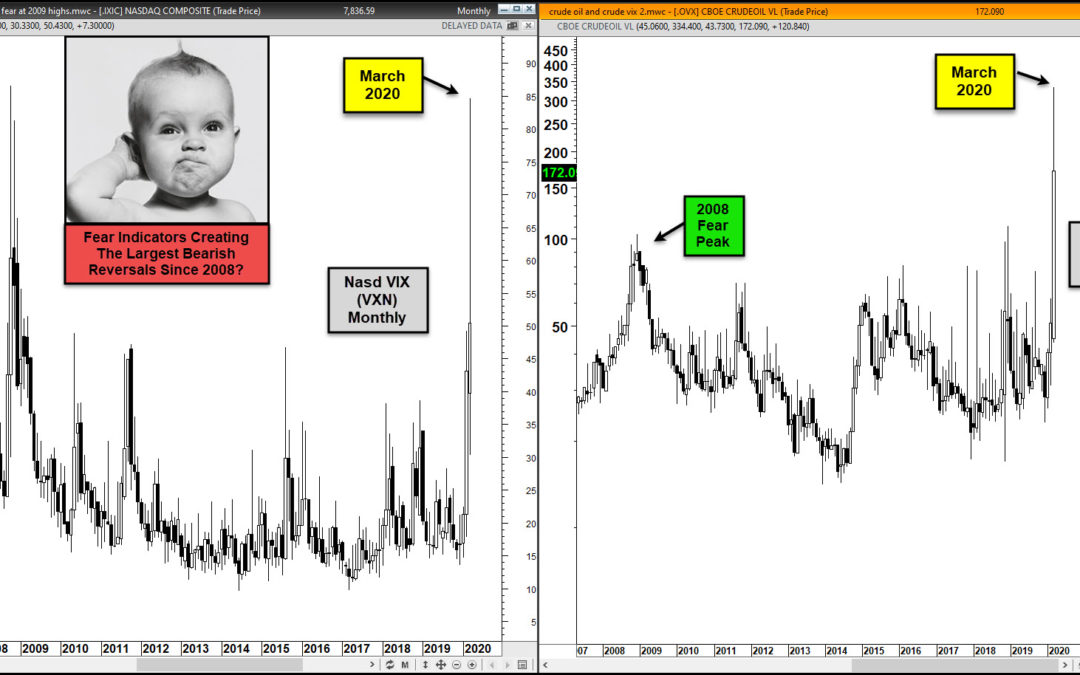
Its been a rough month for Stocks and Crude Oil. Could these two indicators be suggesting that a panic in fear has run out of steam? This 2-pack looks at the fear indicators in the Nasdaq (VXN) and Crude Oil (OVX). Both were at the highest levels in years back in...

by Chris Kimble | Aug 27, 2014 | Kimble Charting
CLICK ON CHART TO ENLARGE The continued rally in the S&P 500 took it to historic levels yesterday, as the index hit 2000 for the first time ever. With these key markets above their 200MA and the Advance/Decline line near all time highs, the trend is up and...

by Chris Kimble | Nov 8, 2010 | Kimble Charting
In the chart below, the pattern appears to be doing the same thing again, yet will it have a different outcome? One day after the April highs I did a post asking if it is “Time to Fear the Techs?” (see post here) The...
