by Chris Kimble | Nov 15, 2013 | Kimble Charting
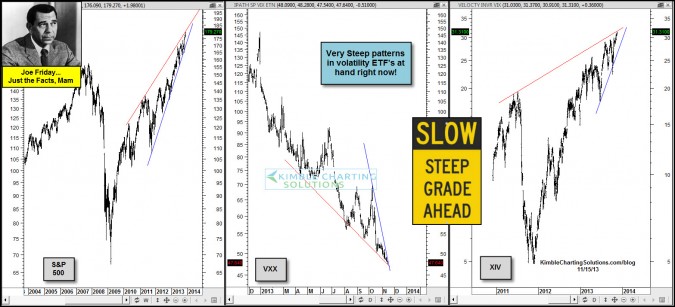
CLICK ON CHART TO ENLARGE The sharp rally in the S&P 500 this year has created very steep patterns in volatility ETF’s (XIV& VXX) Joe Friday…Low back and forth Volatility in these ETF’s (XIV & VXX) hasn’t been the case of late, due...
by Chris Kimble | Aug 14, 2012 | Kimble Charting
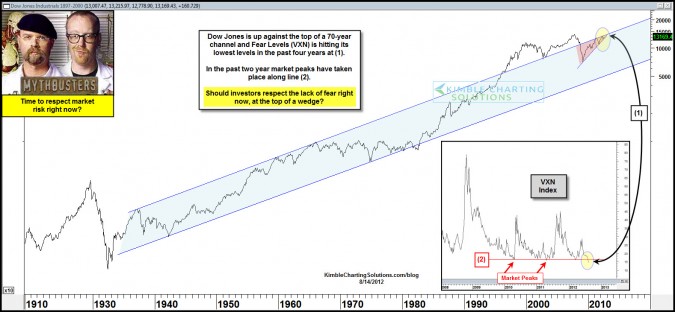
CLICK ON CHART TO ENLARGE The Dow is nearing a 70-year resistance line, at the top of a rising wedge and Fear levels are hitting lows not seen in the past few years. In the past this combo has been a time to be cautious on the markets. Two-thirds of the time a rising...
by Chris Kimble | Feb 10, 2011 | Kimble Charting
The patterns suggested to buy the VIX/VXX due to support being at hand on 1/19 (see post here) The VIX increased over 17% in the next couple of days. (see post here) Now the VIX is back at the same support level, AGAIN! CLICK ON CHART TO ENLARGE Game...

by Chris Kimble | Jan 20, 2011 | Kimble Charting
The patterns suggested yesterday morning to go long the VIX index. (see post here) Rarely will I suggest to pick up the VIX/VXX, yet when certain patterns are present, it is worth holding your nose and jumping into the position. The...

by Chris Kimble | Jan 20, 2011 | Kimble Charting
CLICK ON CHART TO ENLARGE One day a trend does not make! Yesterday some technical support breaks took place that I will address in an upcoming post. Key chart patterns are in place in the above two charts, in that Copper could get tripped up at these lofty...
by Chris Kimble | Nov 16, 2010 | Kimble Charting
CLICK ON CHART TO ENLARGE Anyone notice what the “Patterns have been suggesting we should do” of late? Below is a small summary of suggestions from last week…. Widest Spread between the Nasdaq 100 and the VXN in almost 10 years, with the NDX at...

by Chris Kimble | Nov 12, 2010 | Kimble Charting
Suggested for aggressive investors to “BUY VXX” due to the situation in the chart below (see post here) This chart reflected the “BIGGEST SPREAD” this decade between the Nasdaq 100 and the VXN. Translation…. Too...

by Chris Kimble | Nov 8, 2010 | Kimble Charting
In the chart below, the pattern appears to be doing the same thing again, yet will it have a different outcome? One day after the April highs I did a post asking if it is “Time to Fear the Techs?” (see post here) The...
