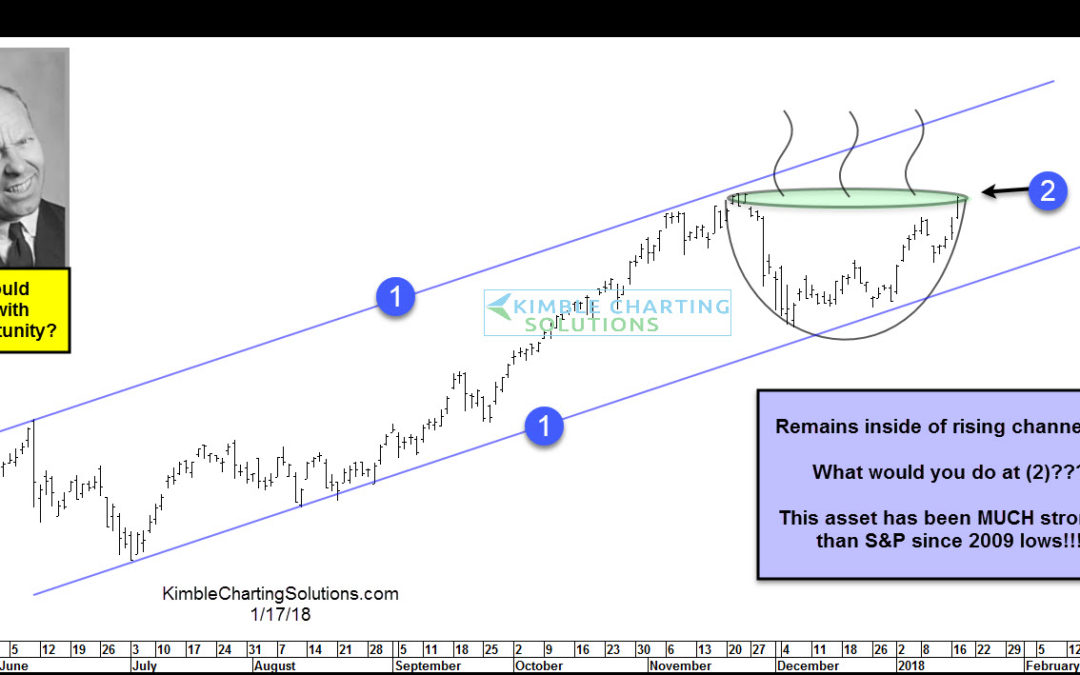
by Chris Kimble | Jan 17, 2018 | Kimble Charting
CLICK ON CHART TO ENLARGE This chart looks at an asset that remains inside of 8-month rising channel (1). It had been weak of late, where it tested rising support at the start of this year. This asset has “Doubled” the S&P 500 since the lows of 2009,...
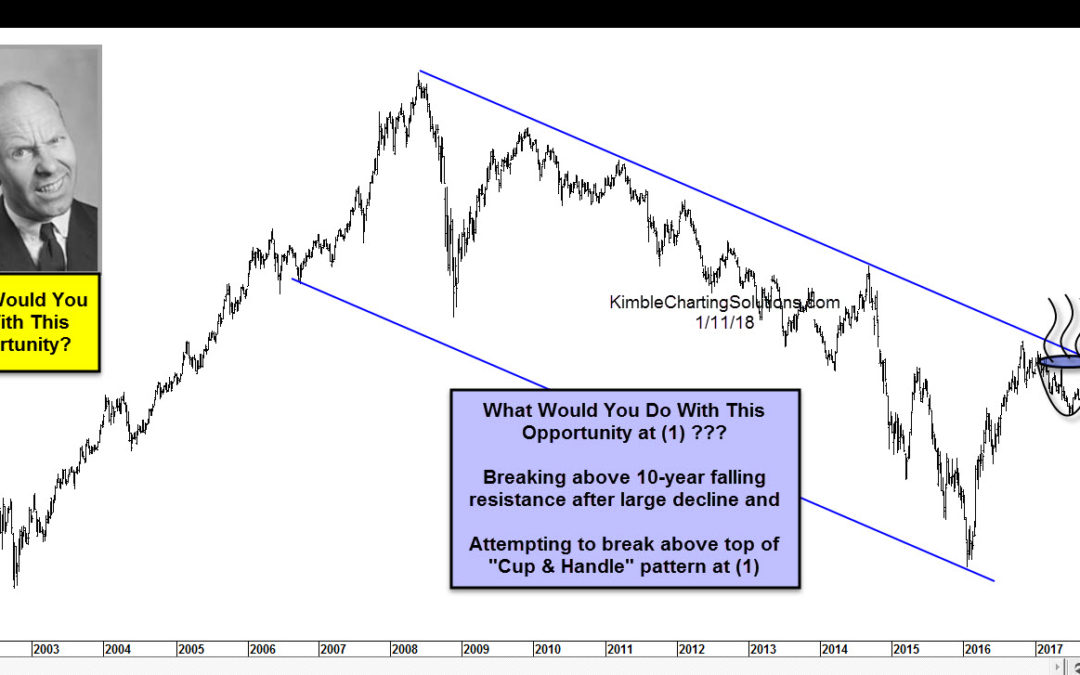
by Chris Kimble | Jan 11, 2018 | Kimble Charting
CLICK ON CHART TO ENLARGE This asset has been hit hard over the past 9-years. Despite the rally of late, it is still 90% below its old highs. It is attempting to break above a 9-year falling channel and above the top of a potential “Cup & Handle”...

by Chris Kimble | Dec 8, 2017 | Kimble Charting
Below looks at an asset that fell over 90% the past couple of years. Is an opportunity at hand? If so what would you do? CLICK ON CHART TO ENLARGE The 90% decline took this asset down to test 20-year rising support line (2), which so far has held. What would you do...

by Chris Kimble | Oct 23, 2017 | Kimble Charting
Below looks at an asset that has been hit very hard over the past few years. Could it be presenting an opportunity? CLICK ON CHART TO ENLARGE This asset is testing the top of a three-year trading range and testing 10-year falling resistance at (1). What would you do...
by Chris Kimble | Oct 17, 2017 | Kimble Charting
Below looks at an asset and its price patterns over the past 20-years. This asset could be forming a multi-year bullish inverse head & shoulders pattern. CLICK ON CHART TO ENLARGE The Power of the Pattern is of the opinion this asset could be forming a very...
