by Chris Kimble | Dec 9, 2020 | Kimble Charting
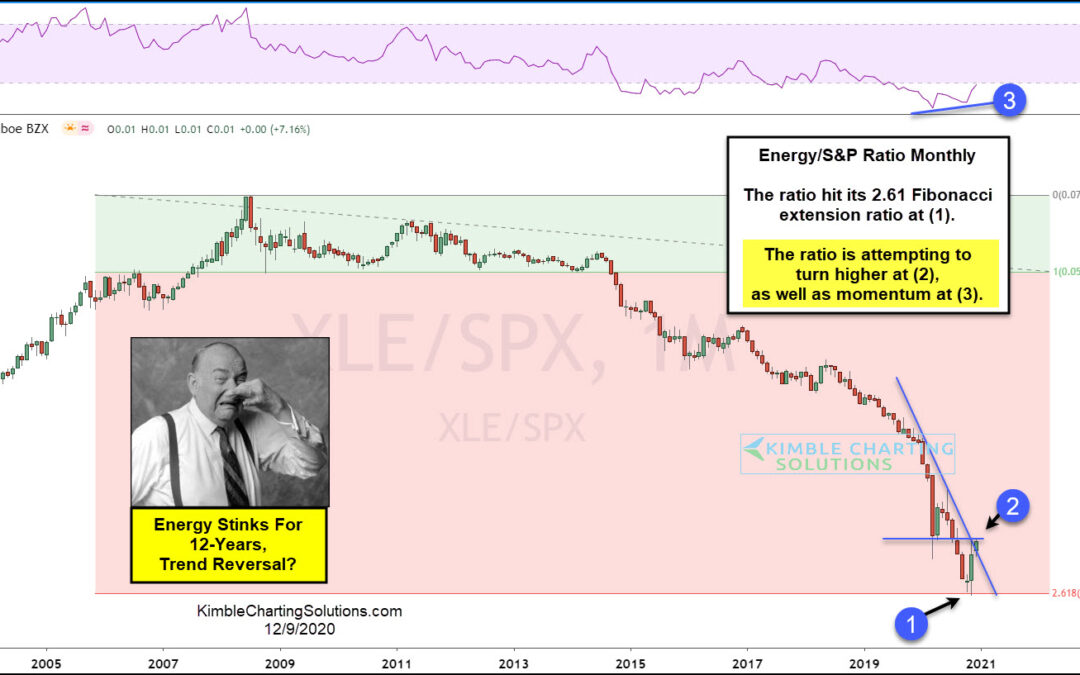
When it comes to sectors that have stunk it up over the past decade, Energy ETF (XLE) wins the award! This chart looks at the Energy ETF (XLE)/ S&P 500 ratio on a monthly basis over the past 17-years. The ratio has been creating lower highs and lower lows since...
