

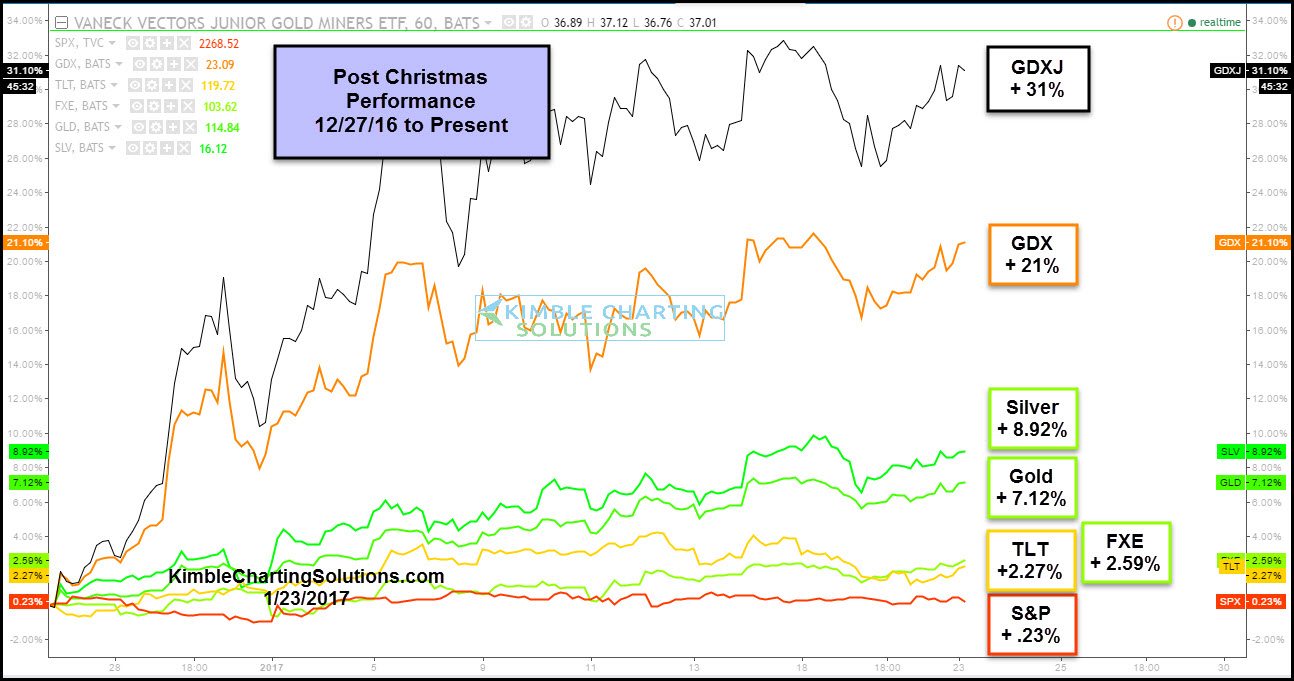
Christmas is now nearly one month ago, how time flies. Ole Santa has been taking a rest and so far over the past month, the S&P 500 has done the same. Not so much for a few other high flying assets!
 CLICK ON CHART TO ENLARGE
Since the first day of trading after the Christmas break, the broad market has been pretty quiet, up .23%. Bonds (TLT) and the Euro (FXE) have made a little bit more than the broad markets.
The Metals Sector has done pretty well since Christmas, as Gold and Silver gaining around 7% more than the S&P and Miners outpacing by a much larger margin.
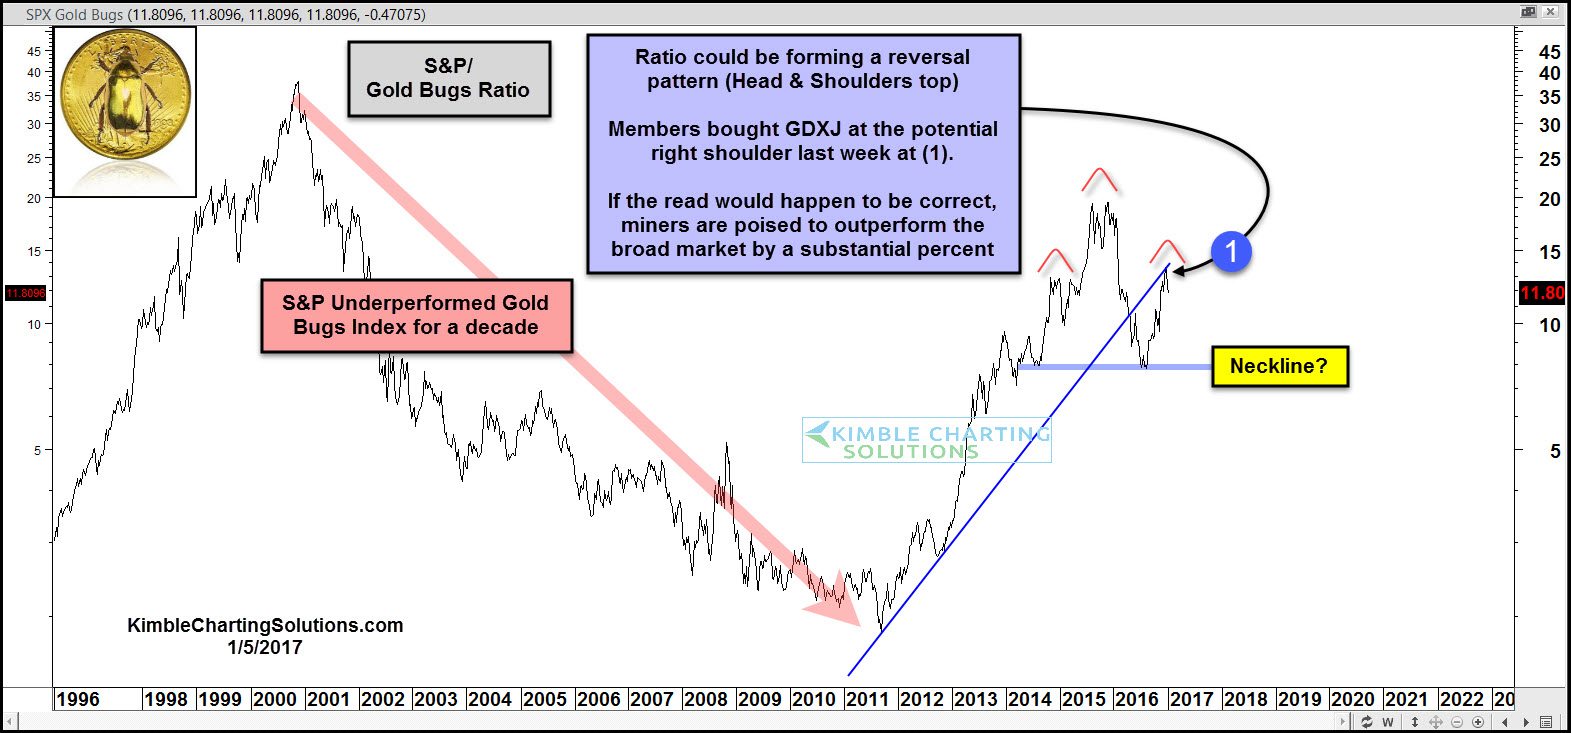
We shared the chart below of the S&P 500 Gold bugs index at the start of this year, see post HERE
CLICK ON CHART TO ENLARGE
This chart looks at the S&P 500/Gold Bugs Ratio over the past 20-years. The Power of the Pattern has been highlighting this pattern to members, suggesting this could be a long-term topping pattern (potential Head & Shoulders pattern). If this read would happen to be correct (not proven so far), the pattern created by billions of free thinking people, would suggest that the Miners could out perform the broad market for a good while. If the ratio is correct, it is suggesting a pair trade of long miners/short S&P.
Full Disclosure; Premium and Metals members are long miners at this time.
