by Chris Kimble | Jan 22, 2024 | Kimble Charting
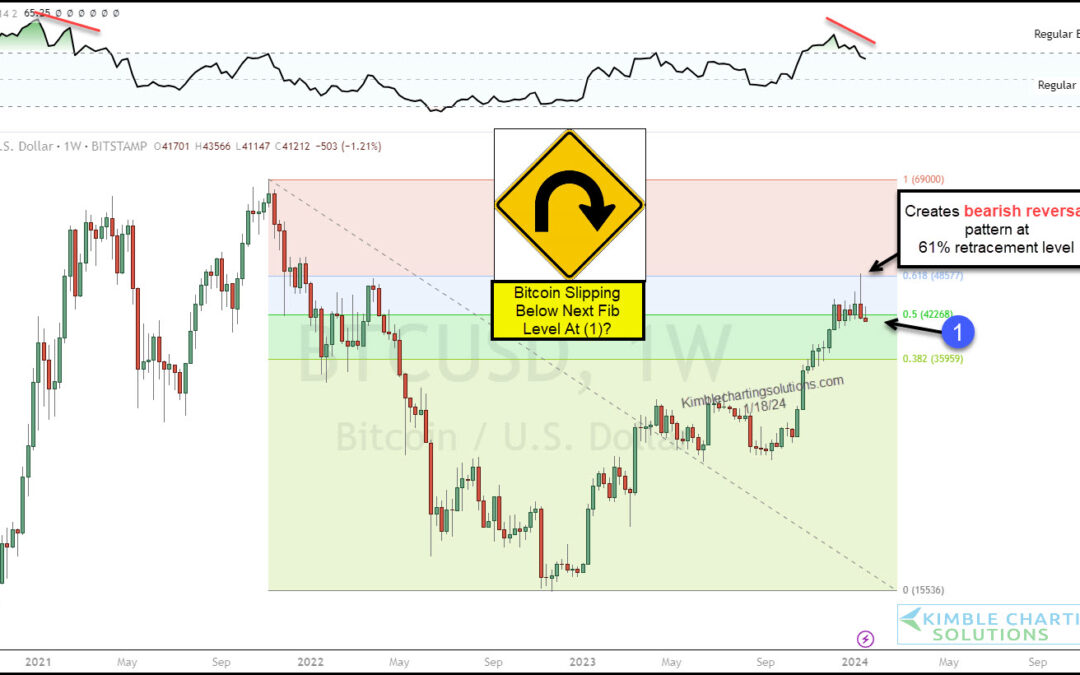
Bitcoin chatter is rising again. With new ETFs coming to market, crypto investors are getting very bullish. Is this a good thing? Or is too much bullishness about to send Bitcoin spiraling? Today we look at a long-term “weekly” chart with Fibonacci levels to show why...
by Chris Kimble | Jan 17, 2024 | Kimble Charting
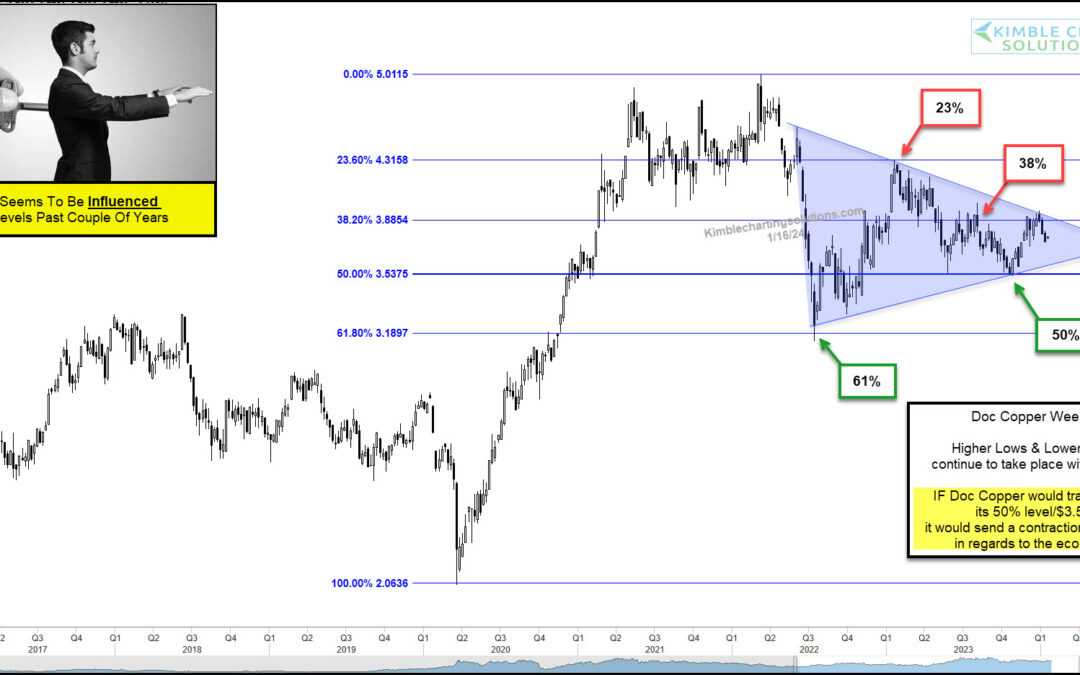
After peaking in 2021, copper prices declined sharply before bouncing around for a few years. That “bouncing” ended up following the twists and turns of Fibonacci rules. And we can see this in today’s “weekly” chart of Copper. Yes, Doc Copper seems to be under the...
by Chris Kimble | Jan 12, 2024 | Kimble Charting
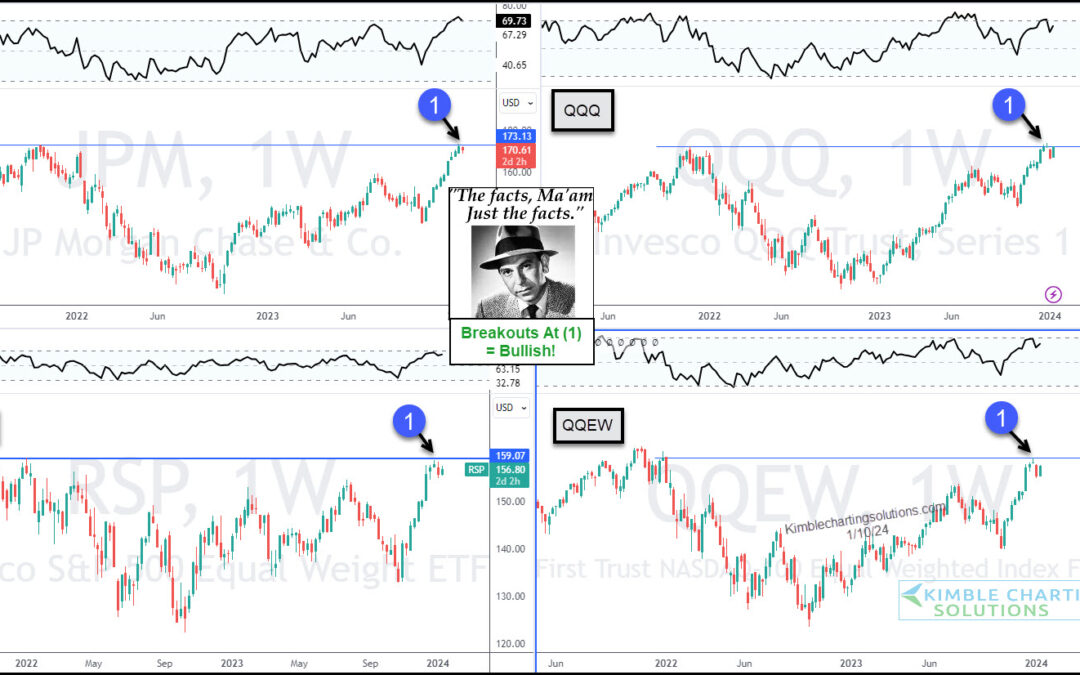
After a big year-end rally, the stock market attempts to consolidate gains in January. That consolidation has several stock indices and ETFs trading near recent price highs. “The facts, Ma’am. Just the facts.” – Joe Friday Today’s chart 4-Pack highlights a key bank...
by Chris Kimble | Jan 11, 2024 | Kimble Charting
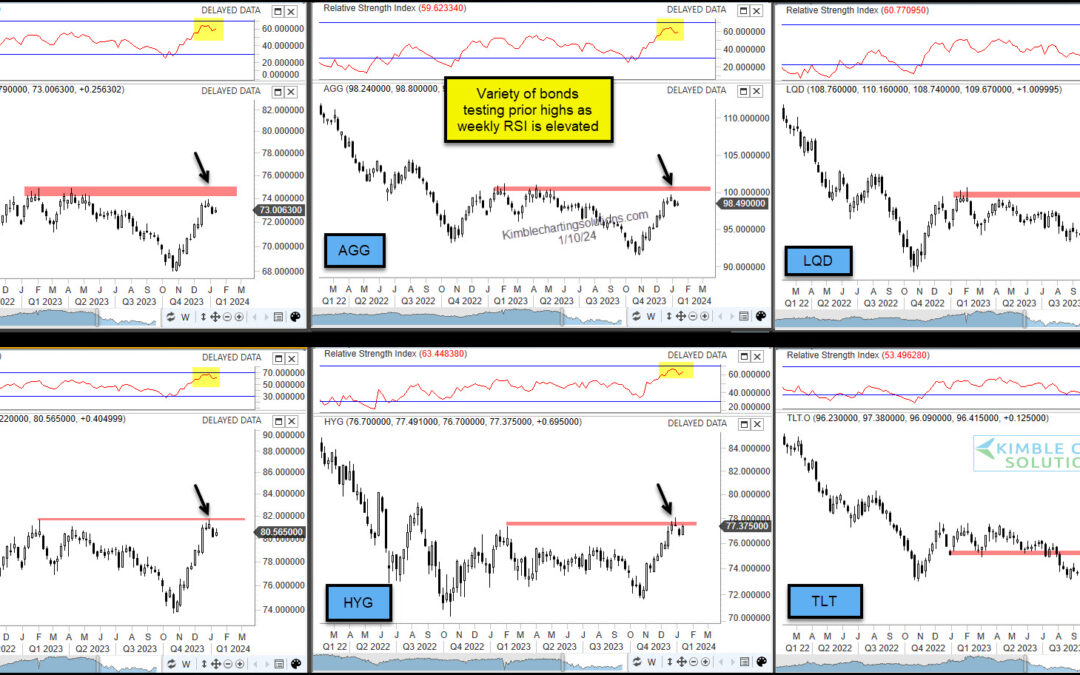
When interest rates fall, bond prices rise. And while it has been some time since we’ve been able to say interest rates are dropping, the past few months have done just that. The pullback in interest rates is coinciding with investors optimism that the Federal Reserve...
by Chris Kimble | Jan 8, 2024 | Kimble Charting
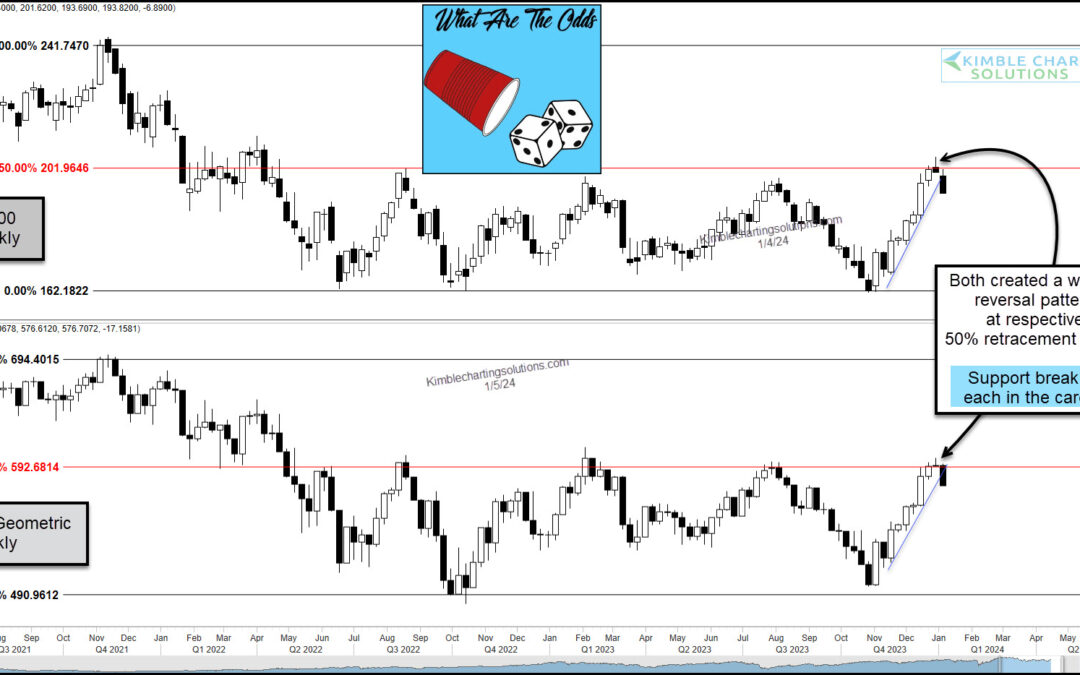
For the past two years, the Russell 2000 and Value Line Geometric Indexes have been lagging. Recently, however, both have come alive… adding a tailwind to the end of year rally. BUT these short-term rallies may be in trouble. Which also could mean that the broad...
by Chris Kimble | Jan 5, 2024 | Kimble Charting
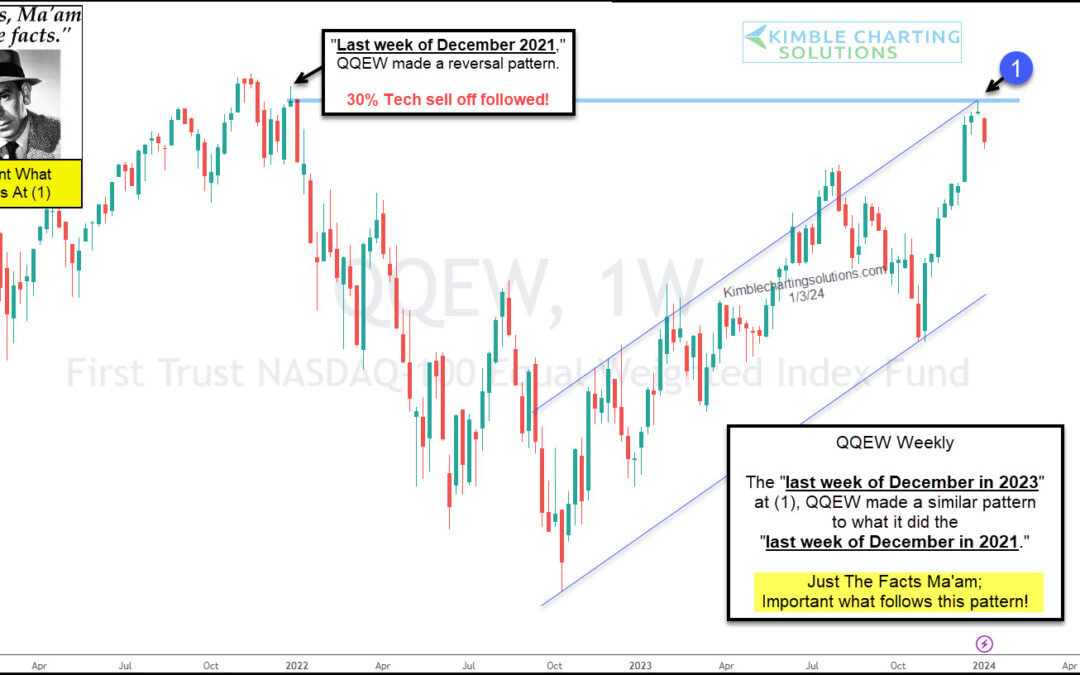
We have spent a lot of time discussing the importance of technology stocks and how this area of leadership is a great “tell” for what’s to come. Today, we look at the Nasdaq 100 Equal Weight ETF (QQEW) and highlight why market participants should be watching right...
by Chris Kimble | Jan 4, 2024 | Kimble Charting
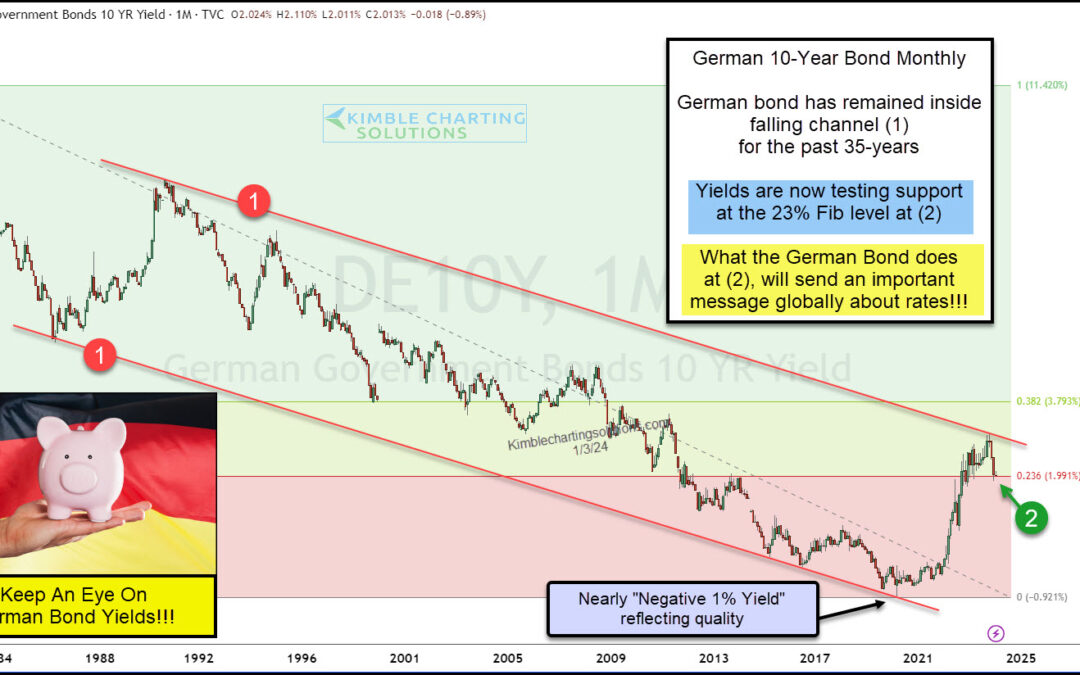
Just as interest rates are pulling back, one particular government rate appears to be nearing an important moment. The 10-Year German Bond yield. Above is a long-term “monthly” chart of the 10-year German Bond Yield. As you may recall, this bond was the only bond of...
by Chris Kimble | Jan 3, 2024 | Kimble Charting
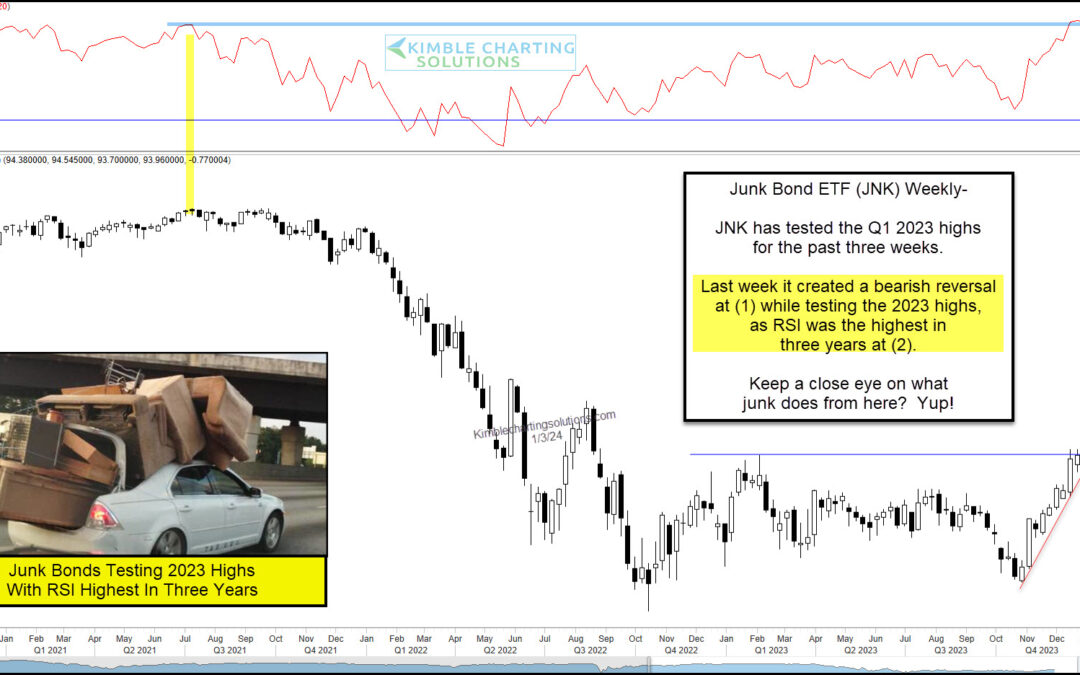
Several risk on indicators surged higher into year-end, such as small-cap stocks and junk bonds. And as we typically see, this coincided with a big year-end stock market rally. Today, we take a look at the Junk Bonds ETF (JNK) to see if this is sustainable into Q1 of...
