
by Chris Kimble | Oct 19, 2017 | Kimble Charting
Earlier this week we sent this message to Premium and Sector Members and I wanted to share it with our viewership today. Below looks at the Bank Index (BKX) over the past 20-years and why the Power of the Pattern feels this could become a very important price point...
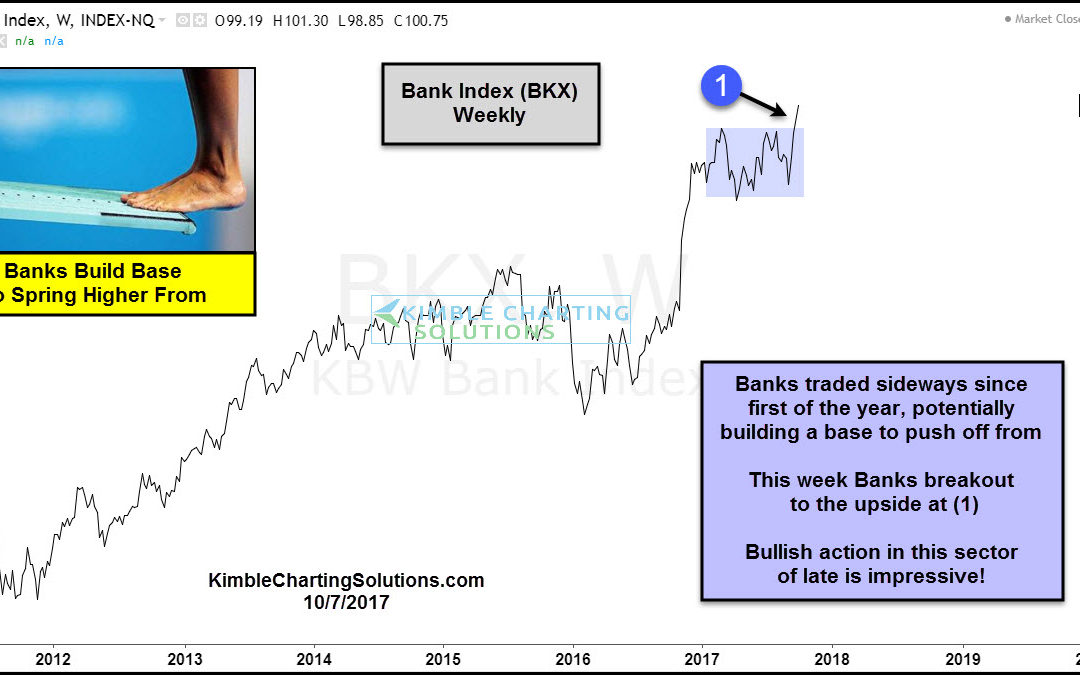
by Chris Kimble | Oct 7, 2017 | Kimble Charting
Since the first of this year, banks didn’t have much to brag about, as they lagged the broad market to the upside. While lagging, they potentially built a base that could reward the owners of banks for a while going forward. Below looks at the Bank Index (BKX)...

by Chris Kimble | Aug 17, 2017 | Kimble Charting
Historically stocks tend to “Start” to get soft this time of year. Below looks at the average performance of the S&P 500 during the month of August over the past 10 & 20-years. CLICK ON CHART TO ENLARGE The typical decline in August is...

by Chris Kimble | Dec 8, 2016 | Kimble Charting
Most quality rallies in stocks, have historically seen banks come along for the ride. Up until a couple of months ago, Banks had been a disappointment to many, as they had lagged the broad market for the prior 18 months. Below looks at the Bank Index (BKX) over the...
