877-721-7217 services@kimblechartingsolutions.com
  • Twitter
  • Twitter
  • Contact
  • Cart
0 Items
Kimble Charting Solutions
  • Blog Sign Up
  • Free Research (Blog)
  • Research Subscriptions
    • Most Popular Research
    • Premium Member Research
    • Weekly Research Reports
  • What We Do
    • What We Do For You
    • Charts Solve These Investing Challenges
    • What You Receive
  • About Us
    • About Us
    • Testimonials
    • Videos
    • As Seen On
  • Login
Select Page
Banks Could Be Sending An Ominous Warning to Investors, Says Joe Friday

Banks Could Be Sending An Ominous Warning to Investors, Says Joe Friday

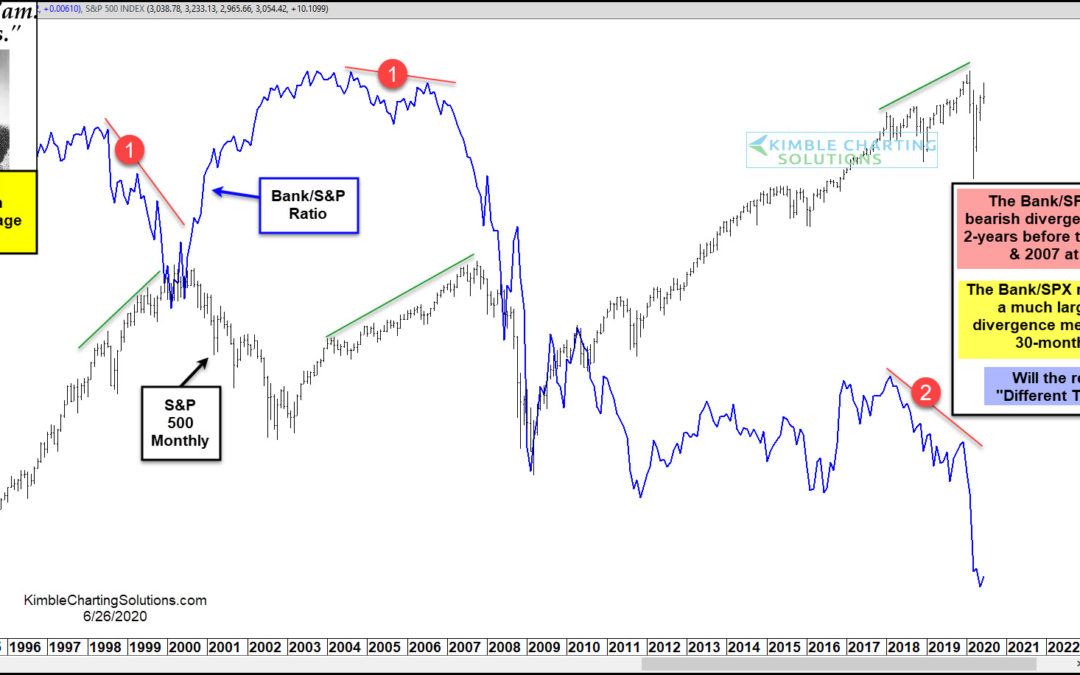
by Chris Kimble | Jun 26, 2020 | Kimble Charting

When the economy is humming along, the stock market tends to out-perform. And one sign of a strong economy is a healthy banking sector. On the flip side, when the economy is struggling, the banking sector lags. And this is a drag on the broader stock market. Today’s...
Will Momentum Divergence Produce Another Bear Market For Stocks?

Will Momentum Divergence Produce Another Bear Market For Stocks?

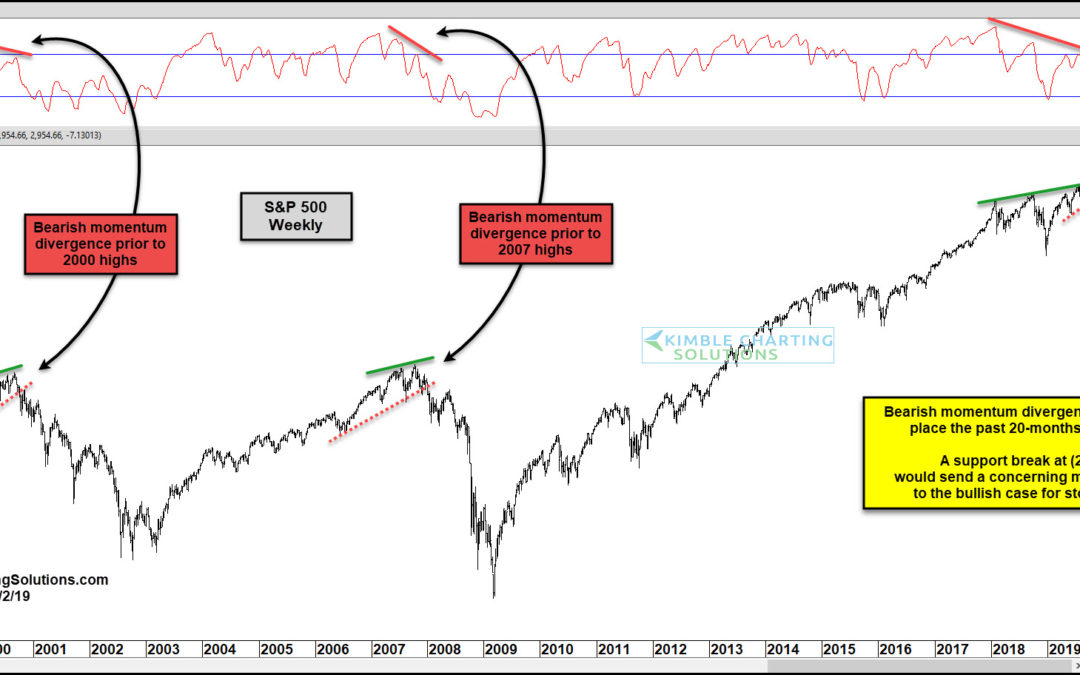
by Chris Kimble | Oct 3, 2019 | Kimble Charting

Stock market deja vu? One key stock market indicator is sending a cautionary message to investors right now… one that we saw back in 2000 and 2007. In today’s chart, we take a long-term look at the S&P 500 Index versus its relative momentum. As you can see,...
S&P; 20-Month Bearish Divergence Could Impact Stocks, Says Joe Friday

S&P; 20-Month Bearish Divergence Could Impact Stocks, Says Joe Friday

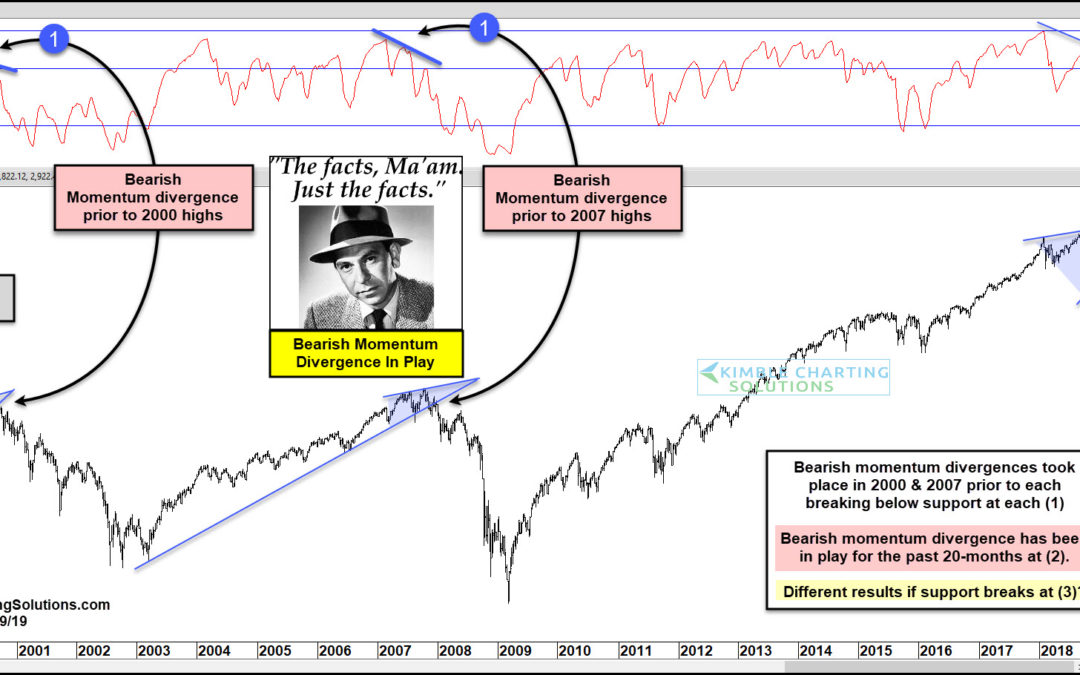
by Chris Kimble | Aug 9, 2019 | Kimble Charting

Does history ever repeat itself exactly? Not so much. Do stock market patterns sometimes and momentum sometimes look the same? Yes, says Joe Friday. This chart looks at the S&P 500 over the past 20-years, on a weekly basis, with momentum in the top section. In...

Topic Areas

10-year yield Apple Banks bonds China Commodities Copper CRB Index Crude Oil DAX Dollar Update Dow Jones Emerging Markets Euro GDX gdxj gld gold Gold Bugs Gold Stocks Govt. bonds High Yields Interest Rates Joe Friday Junk Bonds Kimble Charting Mid-Caps NASDAQ 100 ndx 100 Nikkei 225 NYSE Composite real estate Russell 2000 S&P S&P 500 Shanghai index silver slv SPX spy TLT US dollar What would you do? Wilshire 5000 Yields
  • Terms of Use
  • Contact
  • Twitter

Copyright ©2021 Kimble Charting Solutions. All Rights Reserved | Design by 16Wells