
by Chris Kimble | May 18, 2017 | Kimble Charting
Below looks at the Brazil ETF (EWZ) over the last decade. The rally over the past year has it facing a critical level, from a Power of the Pattern perspective. CLICK ON CHART TO ENLARGE EWZ is facing dual resistance at (1), while in a 9-year down trend of lower highs...

by Chris Kimble | Mar 31, 2014 | Kimble Charting
CLICK ON CHART TO ENLARGE Over the past month the S&P 500 is flat, no big deal. Over that same time period Brazil ETF EWZ is up 7.5%! Is a long-term trend change at hand in Brazil? Unless you live under a rock, you are well aware that BRIC countries have...

by Chris Kimble | Jan 28, 2014 | Kimble Charting
CLICK ON CHART TO ENLARGE My Mentor, Sir John Templeton, was a strong believer in “buy at the point of maximum pessimism!” Unless you live under a rock, you are well aware that Emerging markets have not only had a few rough years, they’ve also...
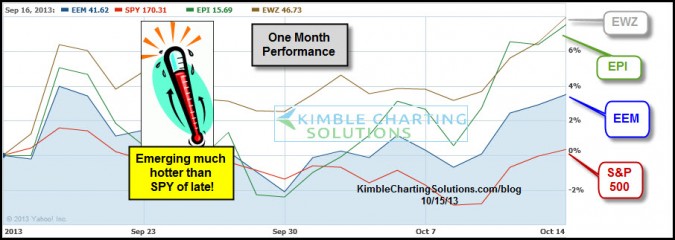
by Chris Kimble | Oct 15, 2013 | Kimble Charting
CLICK ON CHART TO ENLARGE Yes the S&P 500 is within a small percentage of new all-time highs, which is a great sign for the markets and portfolios. Could the shut down in Washington end at any moment and push the S&P 500 higher? Of late though, what has...

by Chris Kimble | Sep 19, 2013 | Kimble Charting
CLICK ON CHART TO ENLARGE Do you believe in the ole concept of Buy Low & Sell High? The Power of the Pattern does! In July the Power of the Pattern reflected to Premium and Sector members that Brazil could be making a “Double Bottom at the bottom of a 3-year...

by Chris Kimble | Mar 26, 2013 | Kimble Charting
The 6-pack below reflects that BRIC ( Brazil, Russia, India & China) and Emerging markets are close to or are breaking key support lines. CLICK ON CHART TO ENLARGE Many pundits continue to tell us that Emerging markets are the growth engine of the...

by Chris Kimble | Dec 17, 2012 | Kimble Charting
Is Santa Claus bringing good cheer to the Emerging markets complex this year? The chart below reflects that BRIC ETF’s/Emerging markets are reflecting relative strength compared to the S&P 500 over the past 60 days. CLICK TO ENLARGE The 4-pack below reflects...

by Chris Kimble | Sep 5, 2012 | Kimble Charting
We’ve heard that the BRIC countries (Brazil, Russia, India & China) are to be the growth engines of the world for several years now. I believe in time they will, yet once the Shanghai Index broke below its multi-year flag pattern, they have all...
