by Chris Kimble | Jun 2, 2014 | Kimble Charting
CLICK ON CHART TO ENLARGE The table below reflects that India has been doing very well so far this year, as its up 26%. That puts it 22% above the S&P 500 this year and 24% better than EEM, a popular Emerging markets ETF. CLICK ON CHART TO ENLARGE The top...

by Chris Kimble | Mar 4, 2014 | Kimble Charting
CLICK ON CHART TO ENLARGE Russia spent a few years and a few Dollars building the Olympic village and getting ready to host the games. Did Putin blow all that goodwill in a few days, after the closing ceremony? I will leave that up to others to debate. The...

by Chris Kimble | Oct 15, 2013 | Kimble Charting
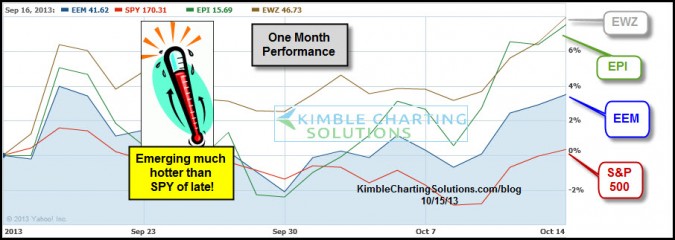
CLICK ON CHART TO ENLARGE Yes the S&P 500 is within a small percentage of new all-time highs, which is a great sign for the markets and portfolios. Could the shut down in Washington end at any moment and push the S&P 500 higher? Of late though, what has...

by Chris Kimble | Sep 9, 2013 | Kimble Charting
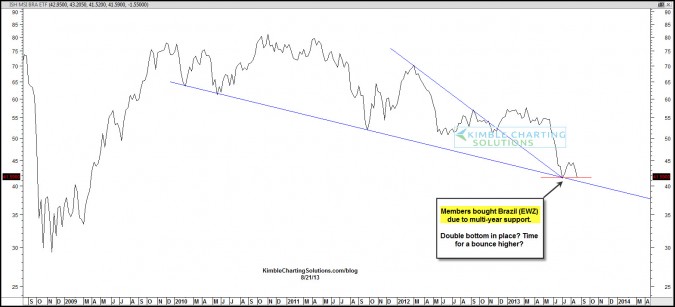
CLICK ON CHART TO ENLARGE Shared the chart above with Premium & Sector/Commodity Sentiment extreme members as well as Stocktwits (here), that Brazil ETF EWZ looked to have formed a “Double Bottom” in the chart above. CLICK ON CHART TO ENLARGE The chart...

by Chris Kimble | Mar 26, 2013 | Kimble Charting
The 6-pack below reflects that BRIC ( Brazil, Russia, India & China) and Emerging markets are close to or are breaking key support lines. CLICK ON CHART TO ENLARGE Many pundits continue to tell us that Emerging markets are the growth engine of the...

by Chris Kimble | Mar 19, 2013 | Kimble Charting
CLICK ON CHART TO ENLARGE The India ETF (EPI) formed a multi-month flag pattern, broke support and the rally over the past few weeks has it kissing the underside of the flag pattern as resistance at (1). If EPI fails to get back above resistance, I would want to...

by Chris Kimble | Dec 17, 2012 | Kimble Charting
Is Santa Claus bringing good cheer to the Emerging markets complex this year? The chart below reflects that BRIC ETF’s/Emerging markets are reflecting relative strength compared to the S&P 500 over the past 60 days. CLICK TO ENLARGE The 4-pack below reflects...

by Chris Kimble | Apr 26, 2012 | Kimble Charting
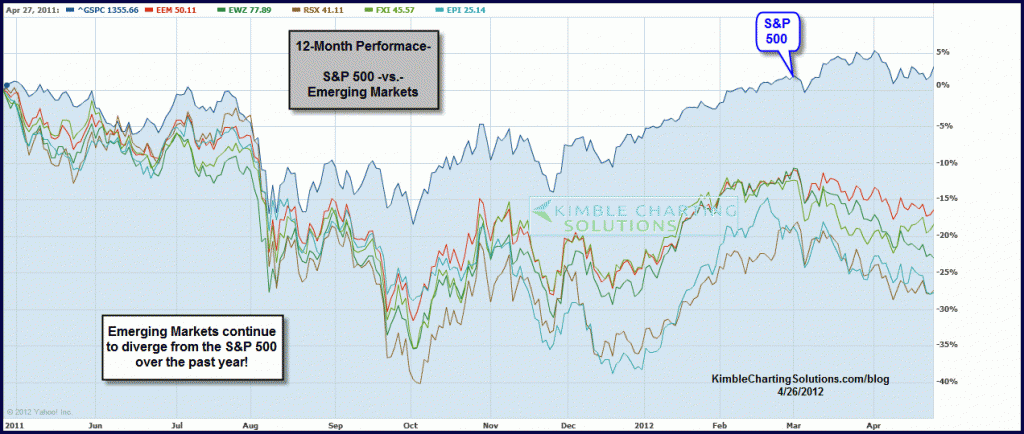
Its very easy to read research papers from Wall Street firms or hear money managers on CNBC tout that the real growth story continues to lie in the “Emerging Markets” arena. They may be correct in the longer-term, yet the Power of the Pattern...


