by Chris Kimble | Feb 12, 2019 | Kimble Charting
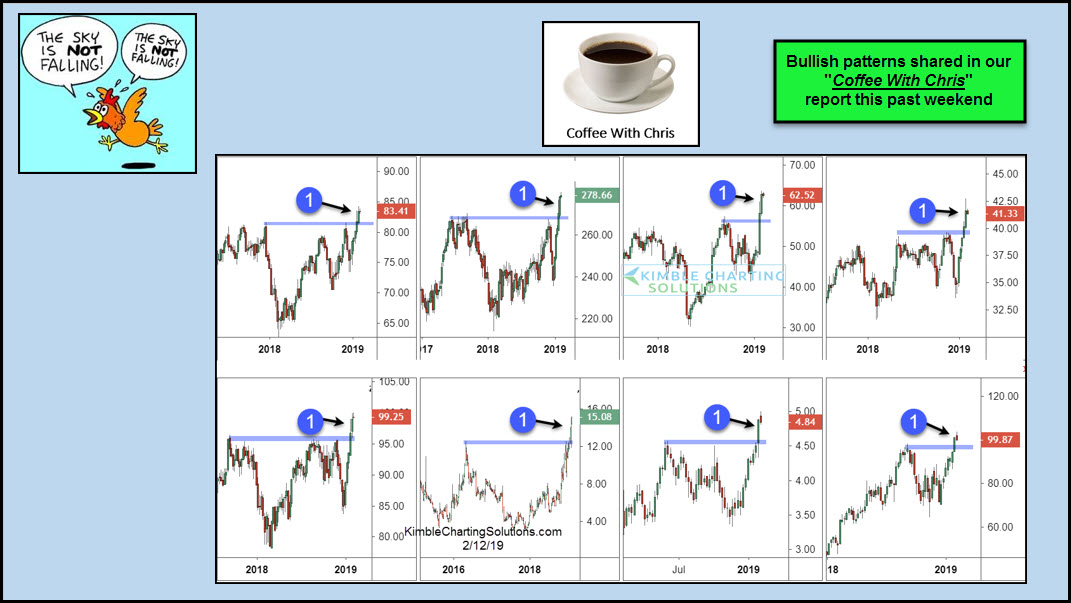
While it seems easy to find articles suggesting that the “Sky Is Falling” or a recession is right around the corner, some assets are reflecting positive patterns and breakouts. This past weekend in our “Coffee With Chris” report, these eight...

by Chris Kimble | Jan 23, 2016 | Kimble Charting
One trend is clear, over the past 90-days, stocks have been soft. Below looks at what markets have been the weakest, during the past 90-days. CLICK ON CHART TO ENLARGE The two “downside leaders” are Transports and Small Caps (Russell 2000). So lets take a...
by Chris Kimble | Dec 15, 2015 | Kimble Charting
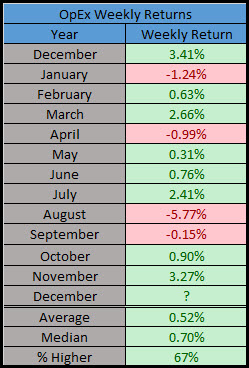
First things first, with the Fed interest rate decision out on Wednesday, this week is anything but normal. With that said, this week is also option expiration week (OpEx). We’ve noted before that this week tends to have an upward bias, but some of the largest...

by Chris Kimble | Nov 2, 2015 | Kimble Charting
CLICK ON CHART TO ENLARGE A month ago the S&P 500 created the “largest reversal pattern (bullish wick)” since THE low in 2011. We shared this reversal pattern with our members the following morning in our weekly wrap up report called “Coffee With...

by Chris Kimble | Oct 26, 2015 | Kimble Charting
CLICK ON CHART TO ENLARGE The “Big Apple” index (NYSE Composite), remains inside of the rising channel that has been in play for the past 50-years. If one applies Fibonacci retracement levels to the 2009 monthly closing lows and the highest monthly close...

by Chris Kimble | Oct 24, 2015 | Kimble Charting
Each week we share our new “Coffee With Chris” report with our members. In the new report, Ryan Detrick and I take a look back on what took place in the prior week in a wide variety of assets and what opportunities lie ahead. If you...
