
by Chris Kimble | Jun 20, 2013 | Kimble Charting
CLICK ON CHART TO ENLARGE The right side of Eiffel tower patterns can be a little bit painful if you are bullish! Gold is down near $100 today, most likely continuing to feel the impact of its Eiffel tower pattern that peaked in August of 2011. Don’t overlook...
by Chris Kimble | Jun 12, 2013 | Kimble Charting
CLICK ON CHART TO ENLARGE Several times the Power of the Pattern has shared that Eiffel tower patterns can be very important to your portfolio construction & management. At the time when most investors were in love with Gold & Apple, I shared that Eiffel tower...

by Chris Kimble | Jun 1, 2013 | Kimble Charting
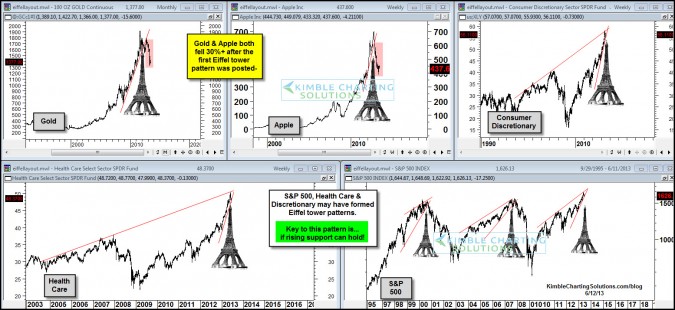
CLICK ON CHART TO ENLARGE If you see the left side of an Eiffel Tower pattern, you often end up experiencing the right side of the tower too! Eiffel Tower patterns have lead to much lower prices in a wide variety of assets. The 4-pack below reflects prior completed...

by Chris Kimble | May 11, 2013 | Kimble Charting
CLICK ON CHART TO ENLARGE Consumer Discretionary and Consumer Staples ETF’s have been white hot over the past 5 years. The table below reflects that Staples (XLP) has gained over twice and Discretionary (XLY) three times as much as the S&P 500 over the...
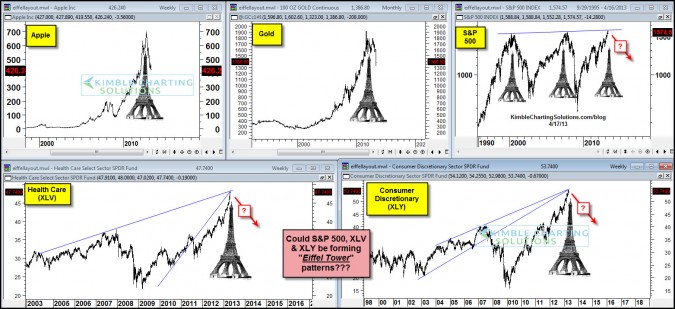
by Chris Kimble | Apr 17, 2013 | Kimble Charting
CLICK ON CHART TO ENLARGE What are and Why could Eiffel Tower Patterns be important to my investments/portfolio? If a rally creates a chart, that looks like the “left side” of the Eiffel tower, investors often end up experiencing the “right...

by Chris Kimble | Mar 19, 2013 | Kimble Charting
CLICK ON CHART TO ENLARGE Consumer Discretionary ETF (XLY) is up 100% more than the S&P 500 over the past two years and is up 80% more than SPY since the 2009 lows. So Goes the Consumer So goes the markets? This relative strength winner has helped pull...
