
by Chris Kimble | Apr 26, 2013 | Kimble Charting
CLICK ON CHART TO ENLARGE In 2007, when stocks (S&P 500) and commodities(CRX Index/Copper) were peaking there was little talk about deflation from the media (inset chart point 1), around the globe. Results going forward…The majority was surprised as...

by Chris Kimble | Apr 25, 2013 | Kimble Charting
CLICK ON CHART TO ENLARGE The U.S. Dollar has rallied since the summer of 2011, almost 2 years! The rally has taken it up to a resistance line that has been in place since 2005. Bullish sentiment levels at this are lofty reaching levels hit only 5 times in the...
by Chris Kimble | Oct 8, 2012 | Kimble Charting
CLICK ON CHART TO ENLARGE Over the past 18 months, the Euro, CRB, FCX and Crude Oil have created a series of lower highs, at falling resistance lines. So far it has paid to reduce long exposure in the key commodities when they hit their respective falling...

by Chris Kimble | Sep 10, 2012 | Kimble Charting
Should you believe what you see??? CLICK ON CHART TO ENLARGE In the past, rallies in these Commodity index’s/assets have suggested the world was expanding and reflecting some economic strength. Should we “Believe” in the breakout and the...

by Chris Kimble | Aug 30, 2012 | Kimble Charting
CLICK ON CHART TO ENLARGE The 4-pack above reflects that key commodity/global growth index’s peaked over a year ago and continue to make a series of lower highs. 2 month rallies have taken place off of the June lows, bringing each of these up to either key...

by Chris Kimble | Jul 25, 2012 | Kimble Charting
CLICK ON CHART TO ENLARGE The CRB Commodity Index lost over half its value in the 2008-2009 decline and then proceed to rally up to its 61% retracement level in May of 2011. The 61% Fib level stopped the CRB on a dime! Despite Benna-Clause attempting to...
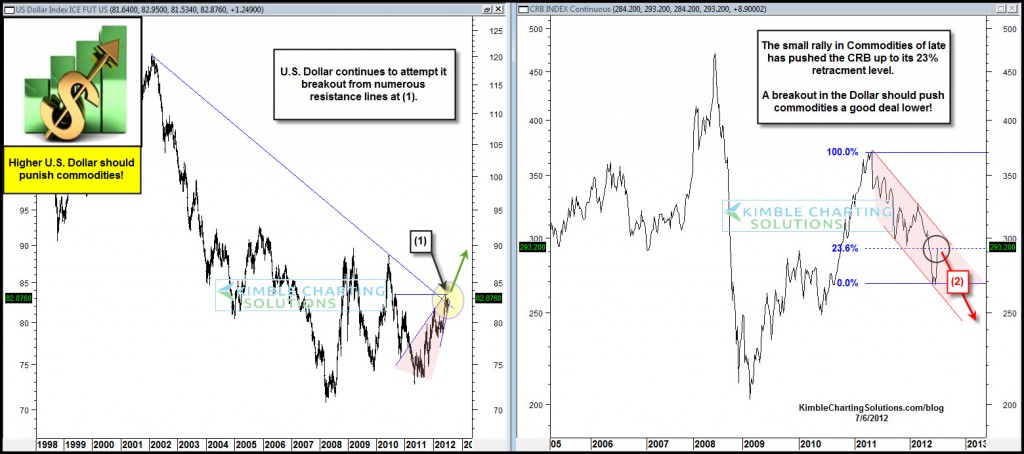
by Chris Kimble | Jul 6, 2012 | Kimble Charting
CLICK ON CHART TO ENLARGE The U.S. Dollar continues to battle with a cluster of resistance at (1) in the left chart above. A breakout above these lines could bring in enough buyers to push the Dollar up to the 90 level in quick order. The CRB index remains inside of...
by Chris Kimble | Jun 1, 2012 | Kimble Charting
The NYSE composite has created a series of lower highs for months and months and months. Believe the message of the S&P 500 or the NYSE? . This index has been sending a message of a soft economy for a long time! The Power of the Pattern reflected on...
