
by Chris Kimble | Feb 19, 2014 | Kimble Charting
CLICK ON CHART TO ENLARGE How does the old saying go…”Don’t judge a book by its cover!” These patterns reflect that the 10-year yield and Commodities Index (CRB) are both pushing a little higher, above resistance lines. Does it...

by Chris Kimble | Jan 28, 2014 | Kimble Charting
CLICK ON CHART TO ENLARGE My Mentor, Sir John Templeton, was a strong believer in “buy at the point of maximum pessimism!” Unless you live under a rock, you are well aware that Emerging markets have not only had a few rough years, they’ve also...

by Chris Kimble | Jan 15, 2014 | Kimble Charting, Sector / Commodity
CLICK ON CHART TO ENLARGE Ever heard of the idea of buy low & sell higher? Believe in it? If not quit reading now! If you do believe in the idea of buy low & sell higher or believe in buying assets that are out of favor, the above chart might be of...

by Chris Kimble | Jan 10, 2014 | Kimble Charting
CLICK ON CHART TO ENLARGE On a day the the job report was much lower than expected and has caused a few to ponder if the economy is slowing down or if growth will remain strong. The CRB index has formed a multi-year pennant pattern which is about to end. The...

by Chris Kimble | Dec 10, 2013 | Kimble Charting
CLICK ON CHART TO ENLARGE If one has invested in the Thompson Reuters/Jefferies CRB Commodities index since 2011, its not been a fun ride as the index is down 25% over the past couple of years and has made a series of lower highs. On the opposite side over the past 18...

by Chris Kimble | Nov 1, 2013 | Kimble Charting
CLICK ON CHART TO ENLARGE Many key commodities are breaking support, ranging from the CRB Index, Crude Oil, Commodities ETF (DBC) and Gasoline futures. This has my attention, due to this…the majority of the time Crude Oil & Gasoline have been soft, it may...

by Chris Kimble | Sep 20, 2013 | Kimble Charting
CLICK ON CHART TO ENLARGE The Shanghai Index and CRB (Commodity Index) have both formed “Bearish Descending Triangle” patterns. Using history as a guide, the majority of the time this pattern suggests lower prices are ahead for both of these. What would...
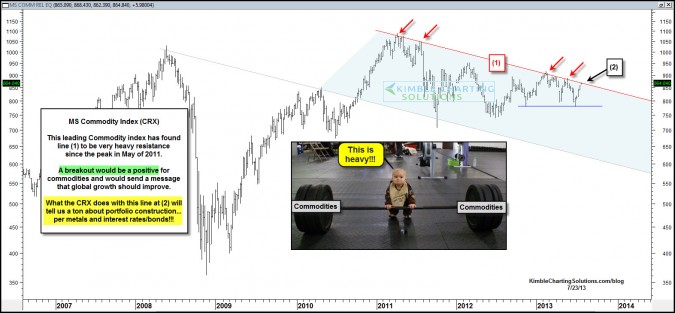
by Chris Kimble | Jul 23, 2013 | Kimble Charting
CLICK ON CHART TO ENLARGE Commodities (MS Commodity Index/CRX) has underperformed the S&P 500 by 40% since May of 2011, reflected in the chart below. I often hear from viewers that the growth picture seems confusing, with stocks hitting all-time highs, yet...
