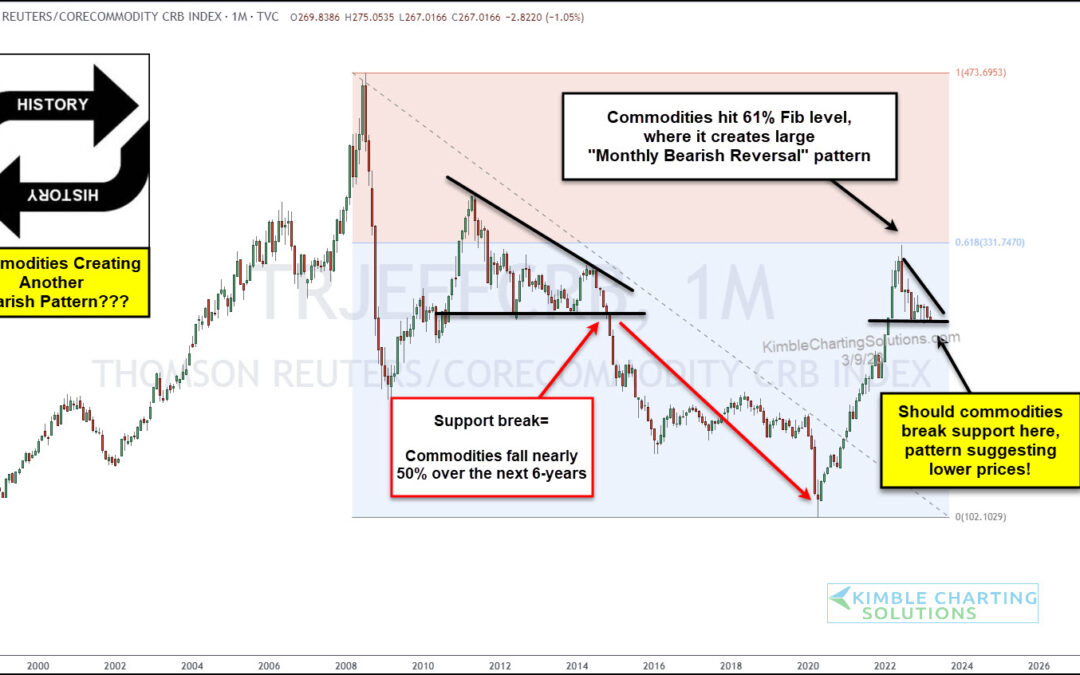
by Chris Kimble | Mar 10, 2023 | Kimble Charting
While inflation continues to dominate the news headlines (and consumer concerns), I think it’s important to highlight an interesting development in the commodities complex. And a potentially positive development! Today we take a look at a long-term “monthly”...

by Chris Kimble | Sep 2, 2022 | Kimble Charting
The red-hot run higher in commodities sent inflation soaring higher. And this lead to the Federal Reserve raising interest rates at a fast clip. BUT it appears that the commodities rally may be slowing down (or over). As this data gets prices in, could it lead to...
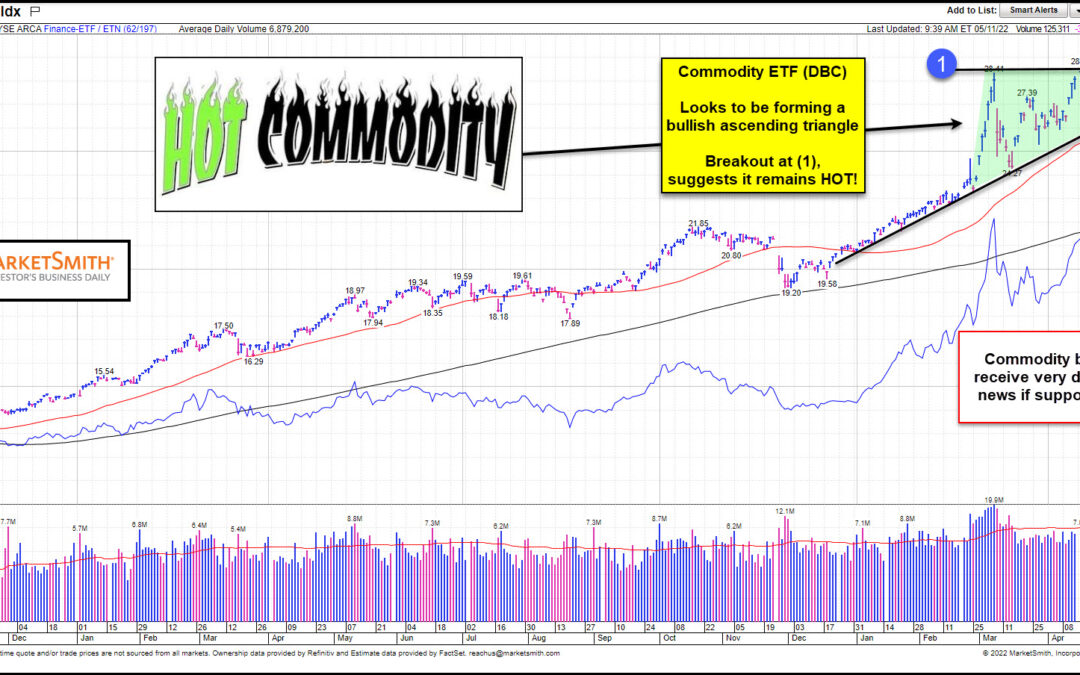
by Chris Kimble | May 12, 2022 | Kimble Charting
Commodities have been one of the few winners in 2022. But with elevated commodity prices, consumers are now left with an ugly dose of inflation on everyday costs (food, energy)… And with falling stock prices, they are getting a dose of deflation in their investment...
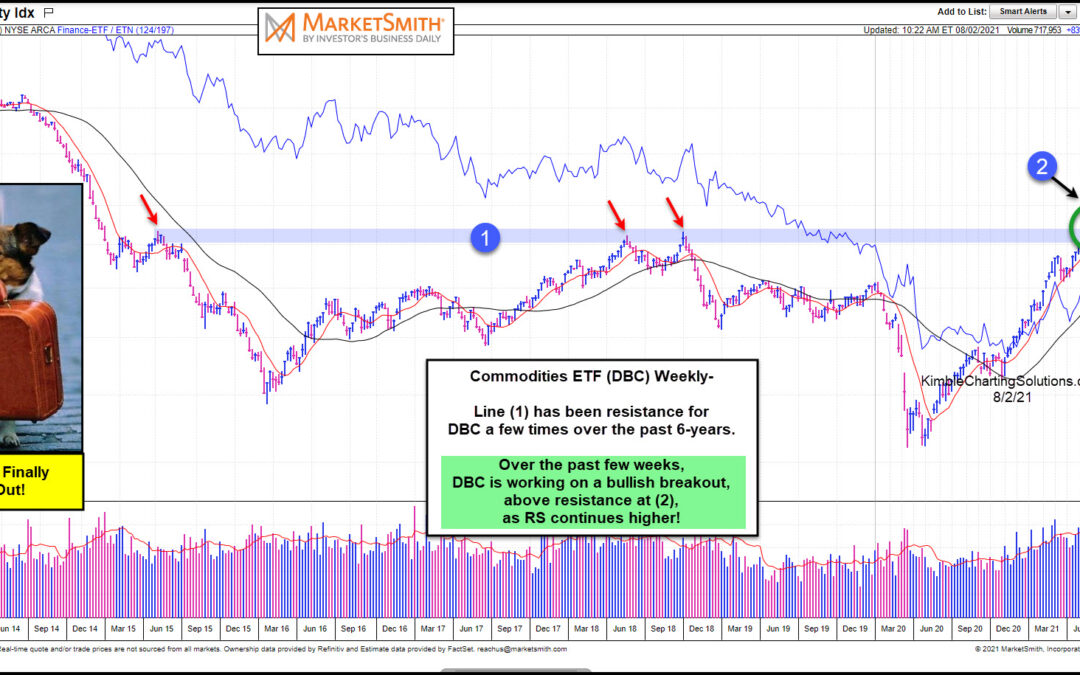
by Chris Kimble | Aug 3, 2021 | Kimble Charting
This chart was created at Marketsmith.com, where you can learn how to trade with the pros for three weeks for only $9.95 I have written a lot about select commodities and the potential for breakouts across the commodities industry. Recently, I have highlighted key...
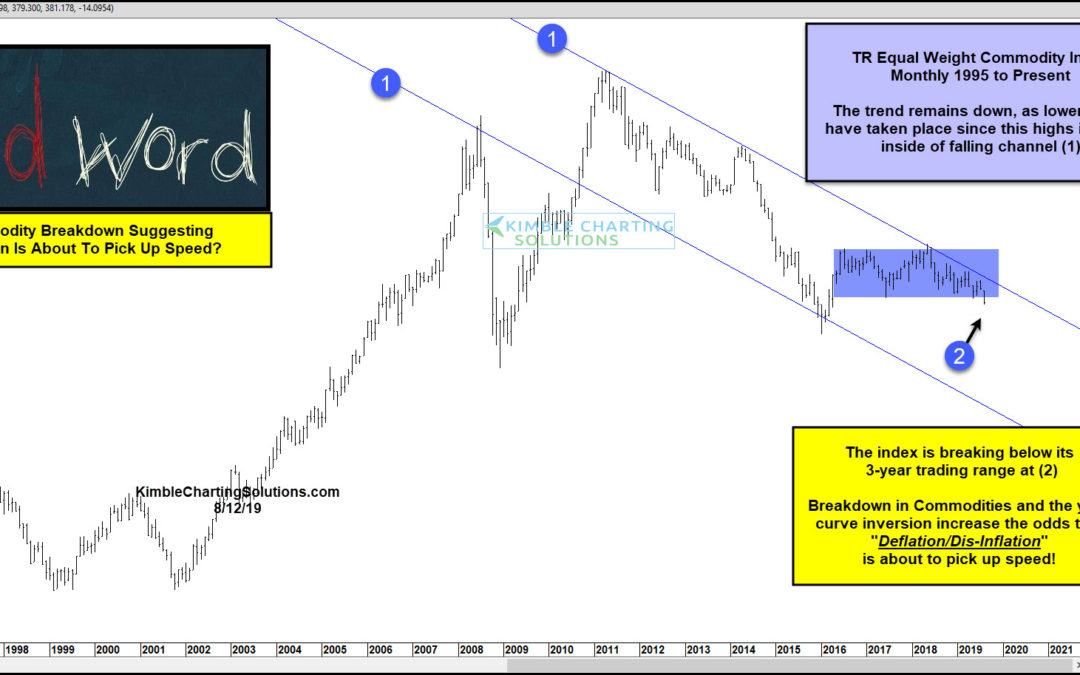
by Chris Kimble | Aug 14, 2019 | Kimble Charting
The big news of the day seems to be the inversion of the yield curve. An inversion oftentimes suggests that the economy will be slowing in the future and recession odds increase. Another important economic message looks to be coming from the Thomson Reuter Equal...

by Chris Kimble | May 21, 2019 | Kimble Charting
Is the Thomson Reuters Equal Weight Commodities creating a long-term bottom? What the index does at (3) over the next few weeks, will go a long way to answering this important question! Commodities don’t have much to brag about over the past 8-years, as lower...
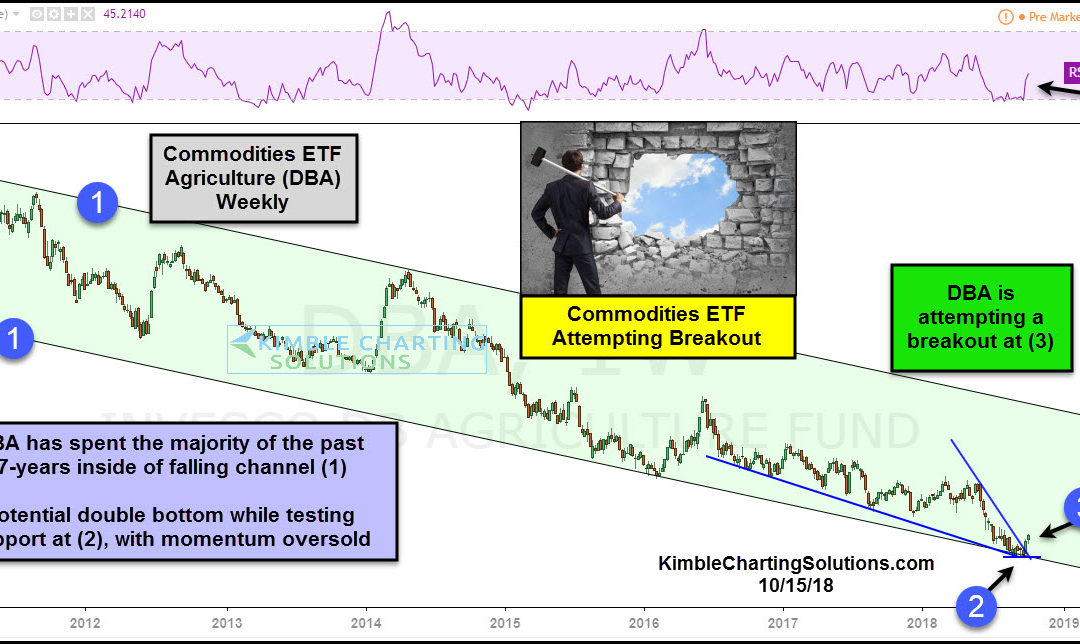
by Chris Kimble | Oct 15, 2018 | Kimble Charting
CLICK ON CHART TO ENLARGE Its been a rough 7-years for Agriculture ETF (DBA) as it has created a series of lower highs and lower lows while declining 50% inside of falling channel (1). The decline this year has it testing channel support of late, where a double bottom...
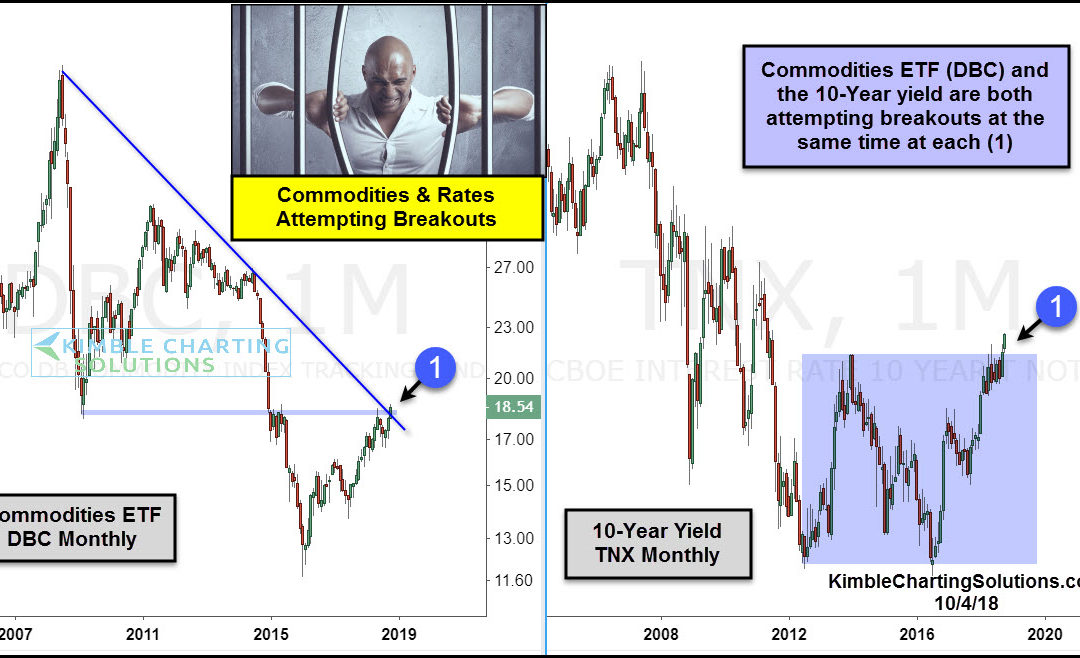
by Chris Kimble | Oct 4, 2018 | Kimble Charting
CLICK ON CHART TO ENLARGE When it comes to assets being in long-term bull markets, Commodities and interest rates do not come to mind, as each has endured long-term bear markets. Could these long-term trends be coming to an end? Possible The 2-pack above looks at...
