by Chris Kimble | Mar 12, 2020 | Kimble Charting
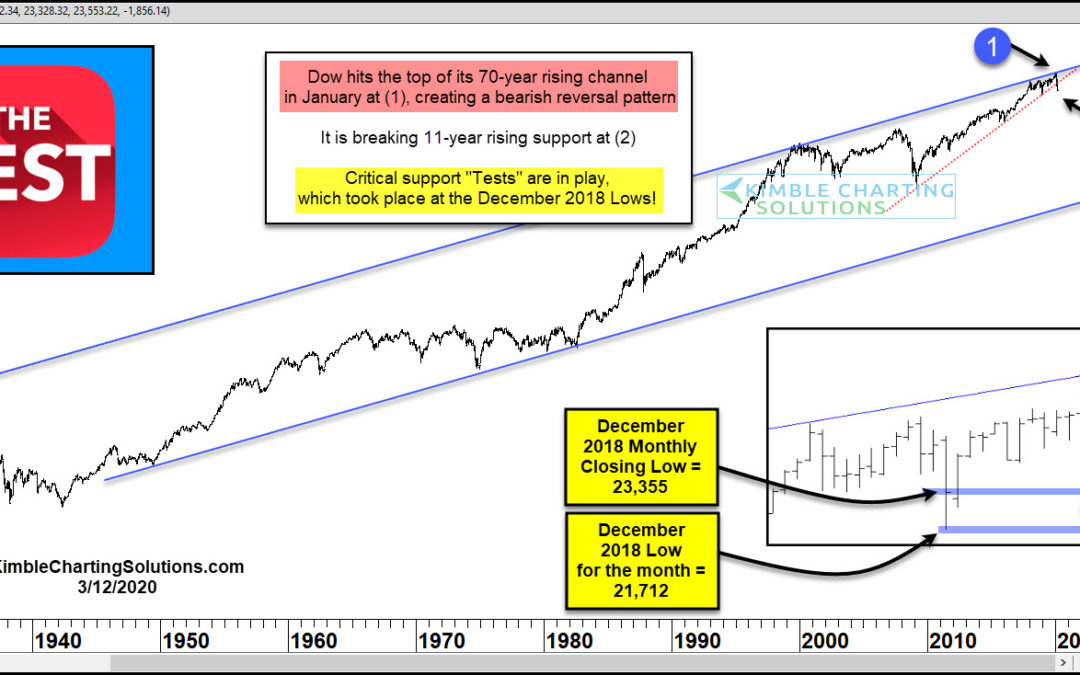
The Dow Jones Industrial Index has remained inside of this rising channel for the majority of the time since the late 1940s. It kissed the underside of the top of this channel in January at (1), where it created a large bearish reversal pattern. The weakness of late...
by Chris Kimble | May 15, 2019 | Kimble Charting
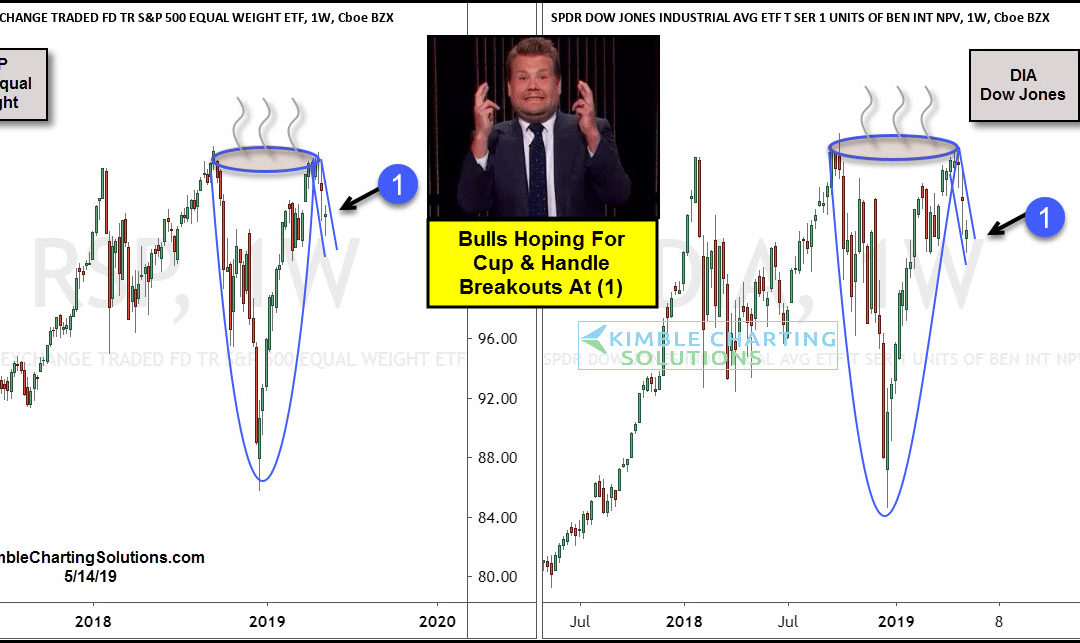
Are the S&P and Dow forming positive “Cup & Handle” patterns over the past 8-months? Bulls sure hope so! A cup and handle price pattern is a technical indicator that resembles a cup and handle where the cup is in the shape of a “U” and...
by Chris Kimble | May 10, 2019 | Kimble Charting
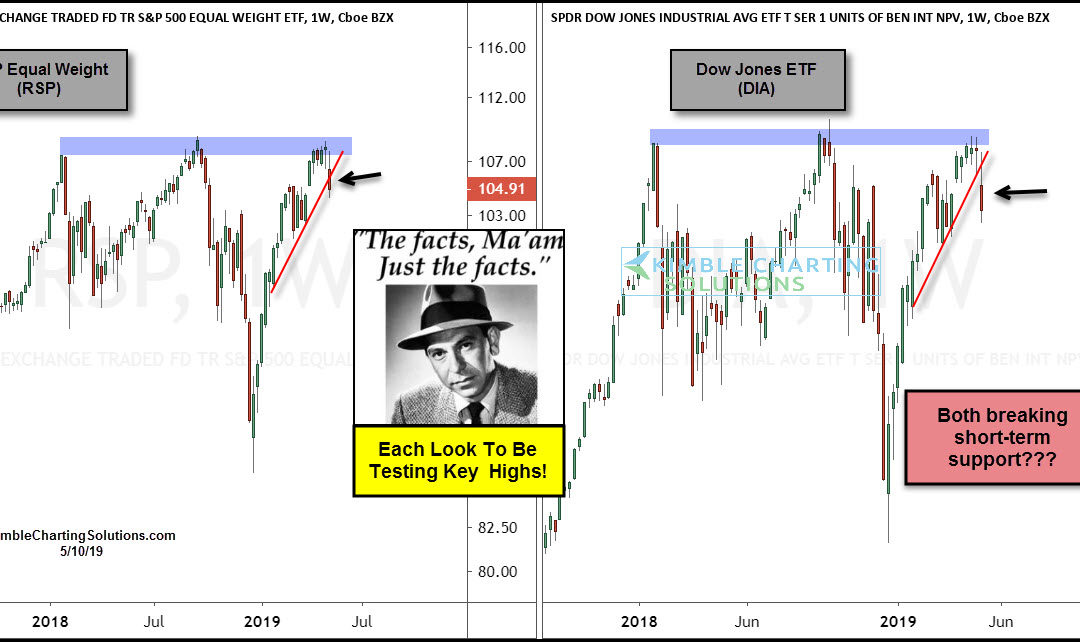
Could the Dow and the S&P both be triple topping at the same time? Possible says Joe Friday This 2-pack looks at the Dow ETF (DIA) and the Equal Weight S&P ETF (SPY) over the past 18-months. Joe Friday Just The Facts Ma’am- Each could be triple topping...
by Chris Kimble | Jan 18, 2019 | Kimble Charting
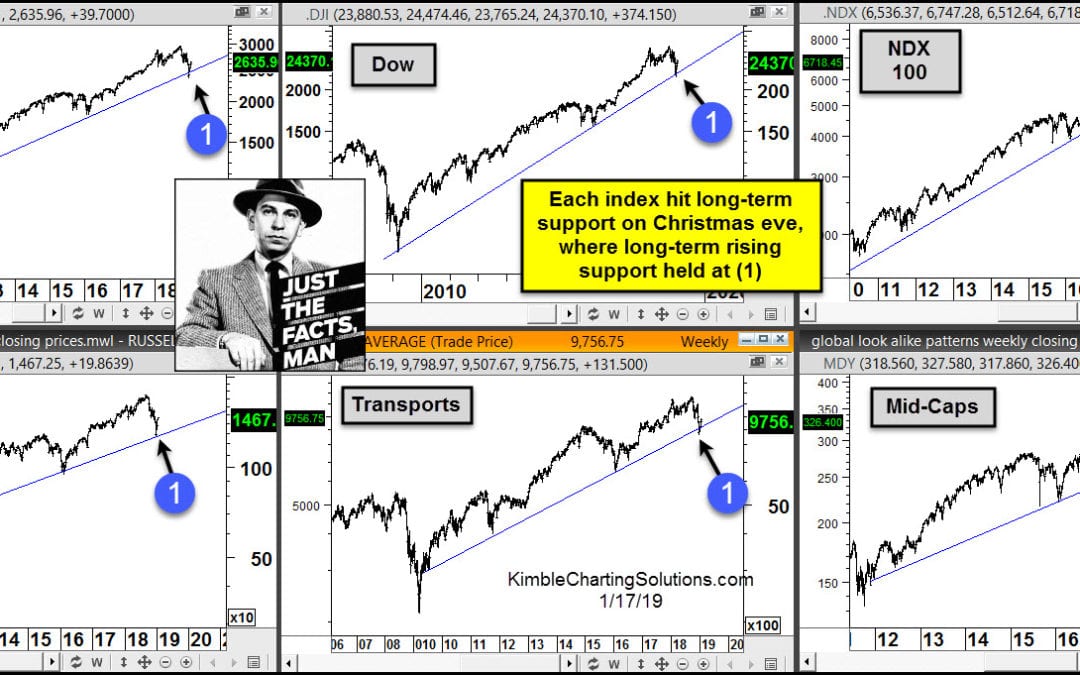
We often hear “Stocks take an escalator up and an elevator down!” No doubt stocks did experience a swift decline from the September highs to the Christmas eve lows. Looks like the “elevator” part of the phrase came true as 2018 was coming to an...
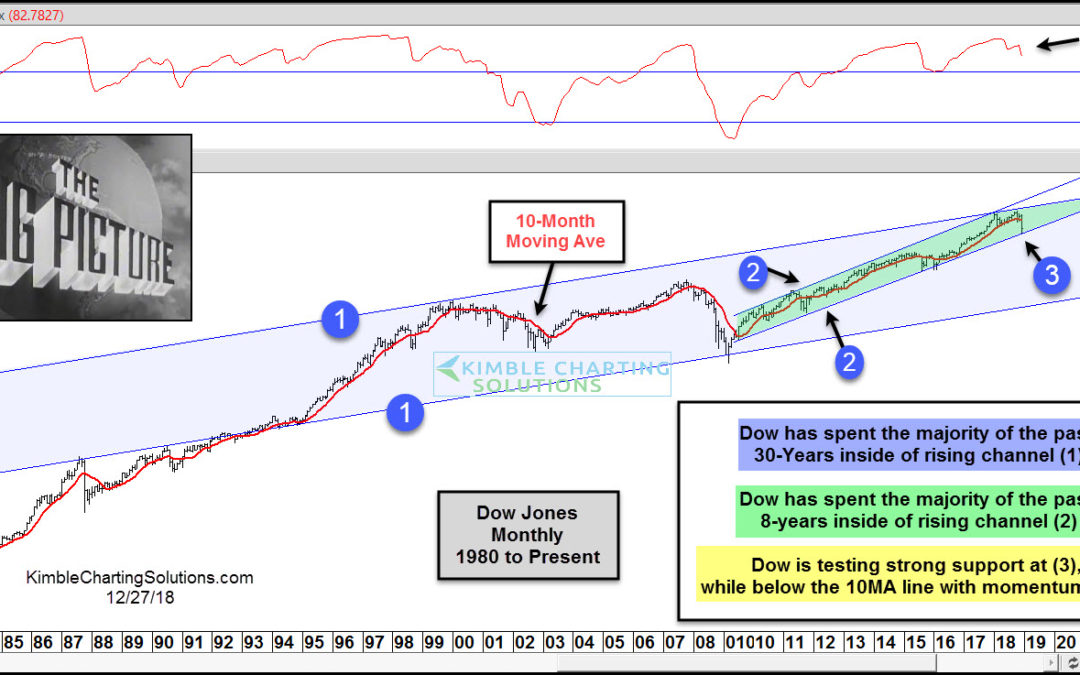
by Chris Kimble | Dec 27, 2018 | Kimble Charting
Whether the Dow is down nearly 20% from the highs of a few months ago or it experiences a 1,000 point rally, what should one do to give proper perspective to these big price moves we’ve experienced of late? In my humble opinion, the best thing to do is look at...
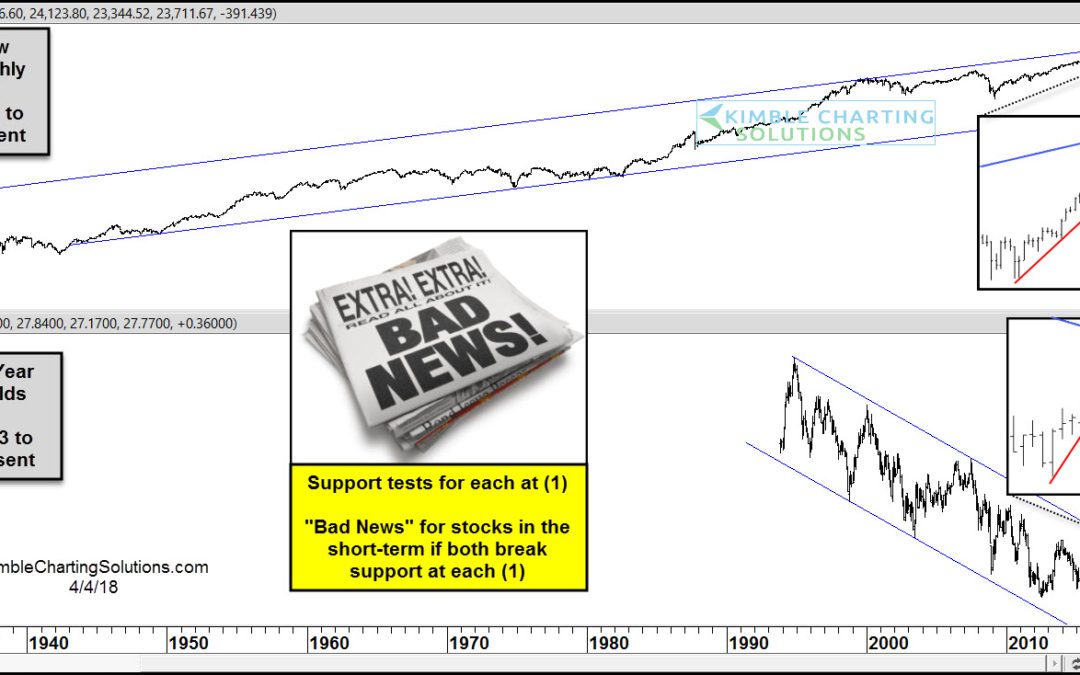
by Chris Kimble | Apr 4, 2018 | Kimble Charting
CLICK ON CHART TO ENLARGE The top chart above highlights that the Dow has spent the majority of the past 70-years inside of a rising channel. The bottom chart highlights that the 10-year yield has spent the majority of the past 25-years inside of a falling channel....

by Chris Kimble | Feb 12, 2018 | Kimble Charting
Back in December, before any market weakness started, we were featured in a CBS MarketWatch article entitled “A Dow Crash? Another 25% Jump? No, Here’s The Case For A Market Freeze In 2018.“ At that time, our research showed that the Dow Jones Industrial...
by Chris Kimble | Nov 22, 2017 | Kimble Charting
Below looks at the Dow Jones Industrials Index over the past 100 years on a monthly closing basis- In the early 1980’s the Dow used old resistance to become new support at (1), where a breakout and strong rallied followed. CLICK ON CHART TO ENLARGE The Dow looks...
