by Chris Kimble | Oct 3, 2018 | Kimble Charting
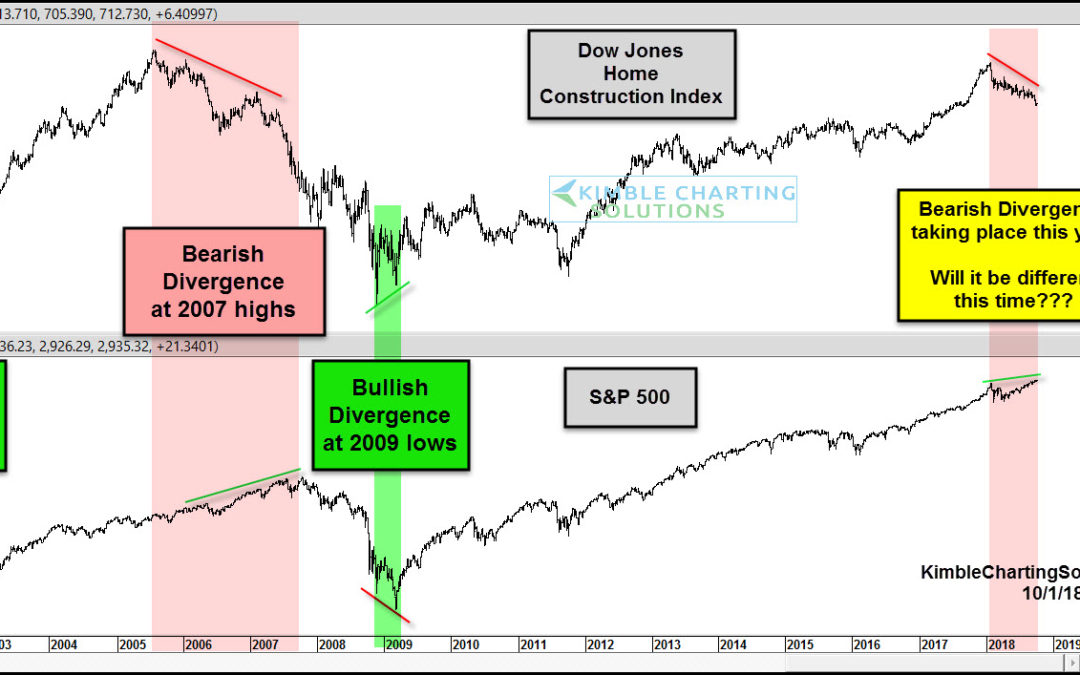
Interest rates are steadily creeping higher. And housing, as measured by the several housing related ETFs and Indexes is facing a slowdown. And not very many people are talking about it. Well, it’s time to put it on your radar! Housing carries implications for the...
by Chris Kimble | Nov 19, 2014 | Kimble Charting
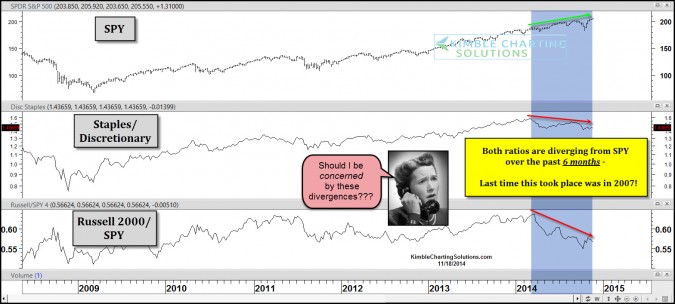
CLICK ON CHART TO ENLARGE Looking back at 2006/2007, several key market indicators started diverging from the S&P 500, before the large decline in 2007/2008 took place. The above chart compares the Staples/Discretionary and Russell 2000/SPY ratios against...
