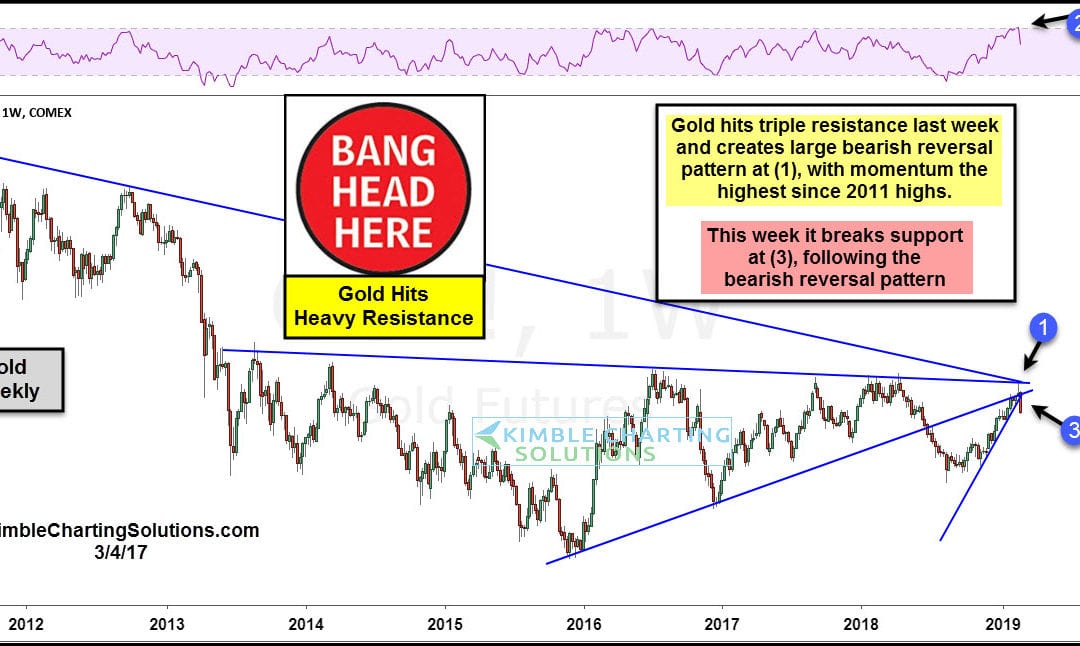
by Chris Kimble | Mar 4, 2019 | Kimble Charting
Precious metals have been a hot topic for investors and the financial markets. Gold, in particular, has caught the eye of market participants. After a 6 month rally into February, Gold futures reversed hard to the downside. This reversal came as gold prices tested...
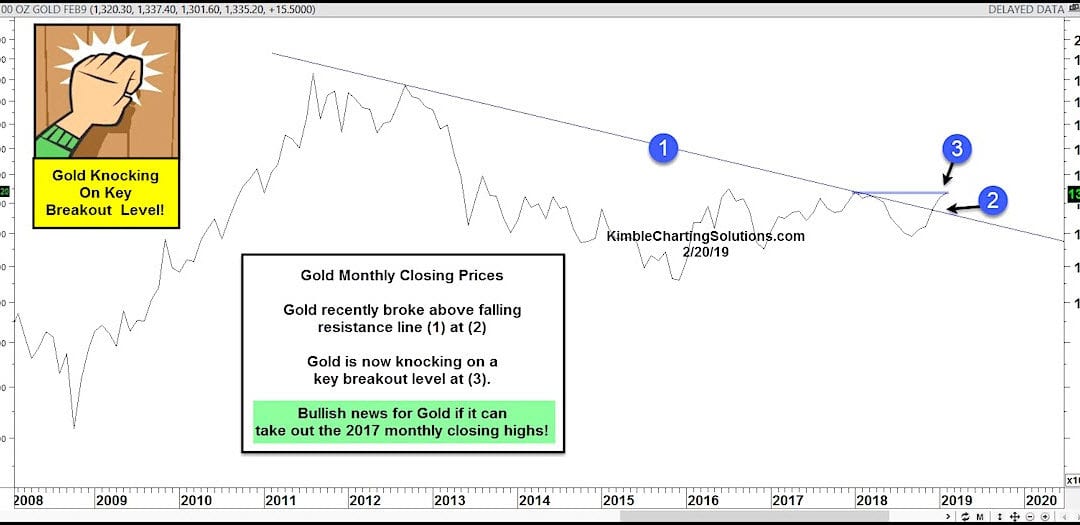
by Chris Kimble | Feb 21, 2019 | Kimble Charting
For the past 5 years, Gold prices have traded sideways. There were plenty of “trades” to be made, but that type of price action tends to grind out long-term bulls and bears. You can see this in today’s “monthly” closing chart for Gold (shown below). Gold bulls caught...
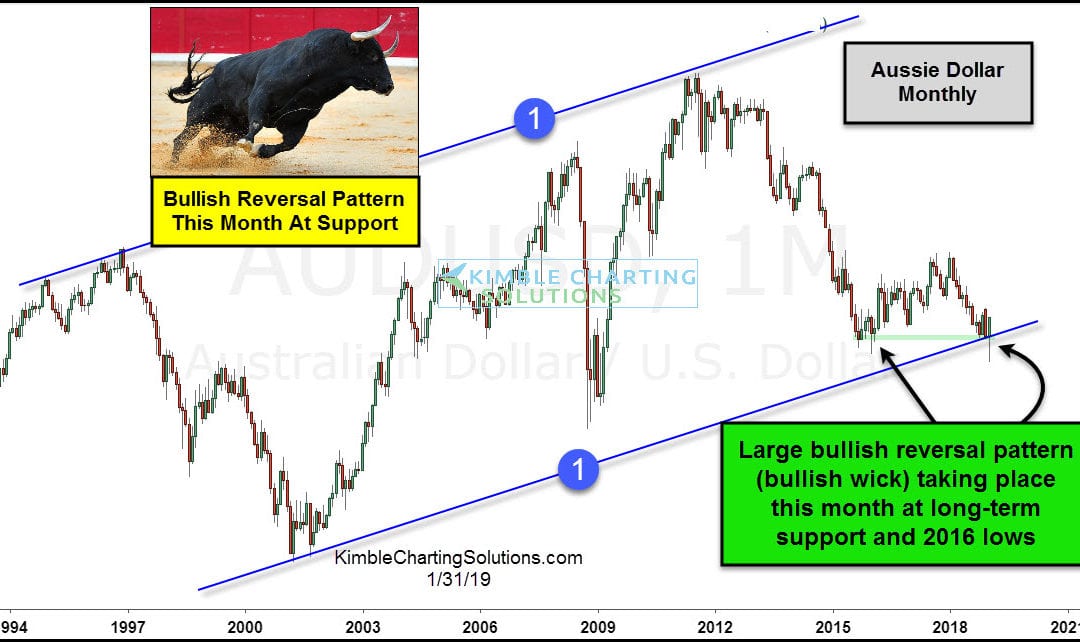
by Chris Kimble | Jan 31, 2019 | Kimble Charting
Is the Aussie Dollar signaling that a major commodity low is being established this month? Possible! The Aussie Dollar and commodities have been highly correlated for a couple of decades. The AU$ has spent the majority of the past couple of decades inside of rising...
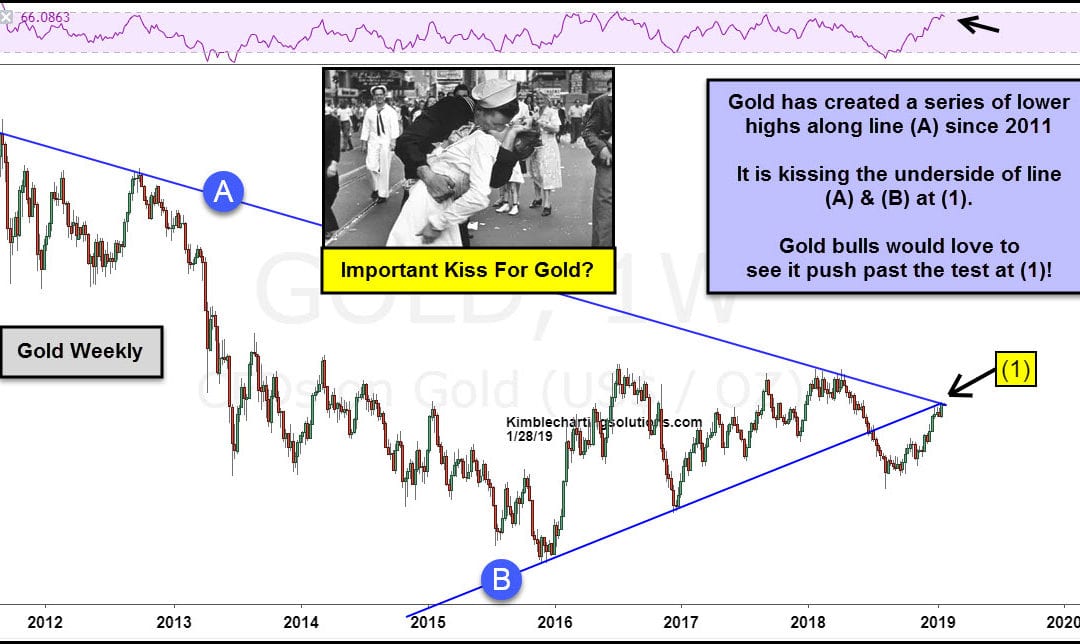
by Chris Kimble | Jan 28, 2019 | Kimble Charting
Gold is testing a key inflection point that could determine where it is months and months from now! Gold has created a series of lower highs over the past 8-years just below line (A). The rally over the past 4-months has gold testing the underside of this falling...
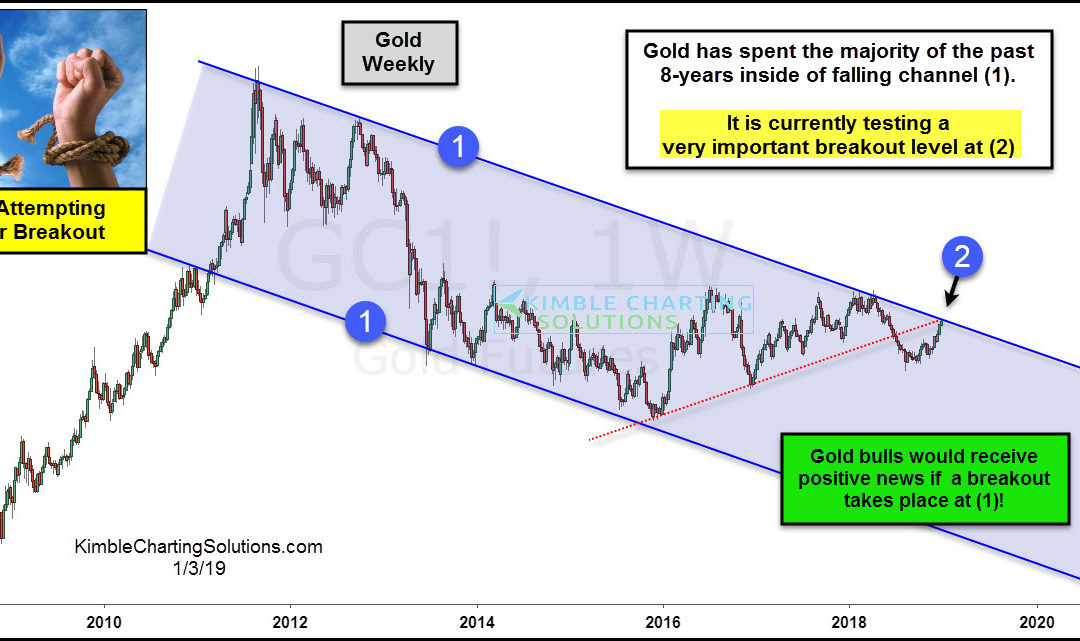
by Chris Kimble | Jan 3, 2019 | Kimble Charting
Since the 2011 highs, Gold futures have created a series of lower highs and lower lows inside of falling channel (1). The rally since the lows in 2016 has Gold facing the top of its 8-year falling channel at (2). This test comes into play as resistance for Gold,...
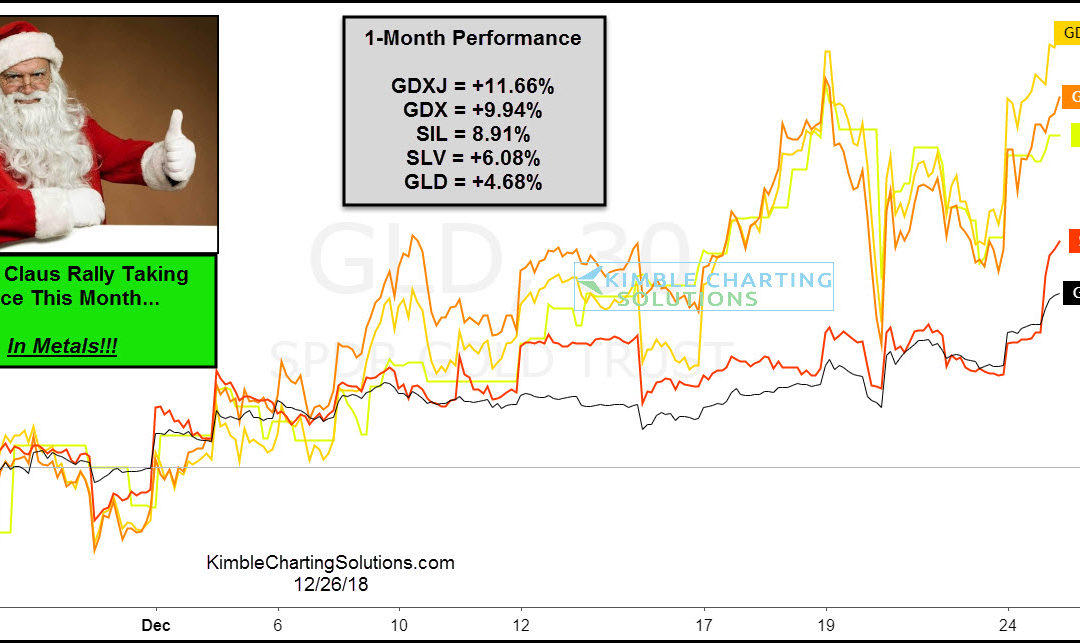
by Chris Kimble | Dec 26, 2018 | Kimble Charting
While it’s easy to find articles that suggest a Santa Claus rally isn’t taking place this year, the Power of the Patterns would disagree! This chart looks at the performance from several assets in the metals sector the past 30-days. Even though all of...
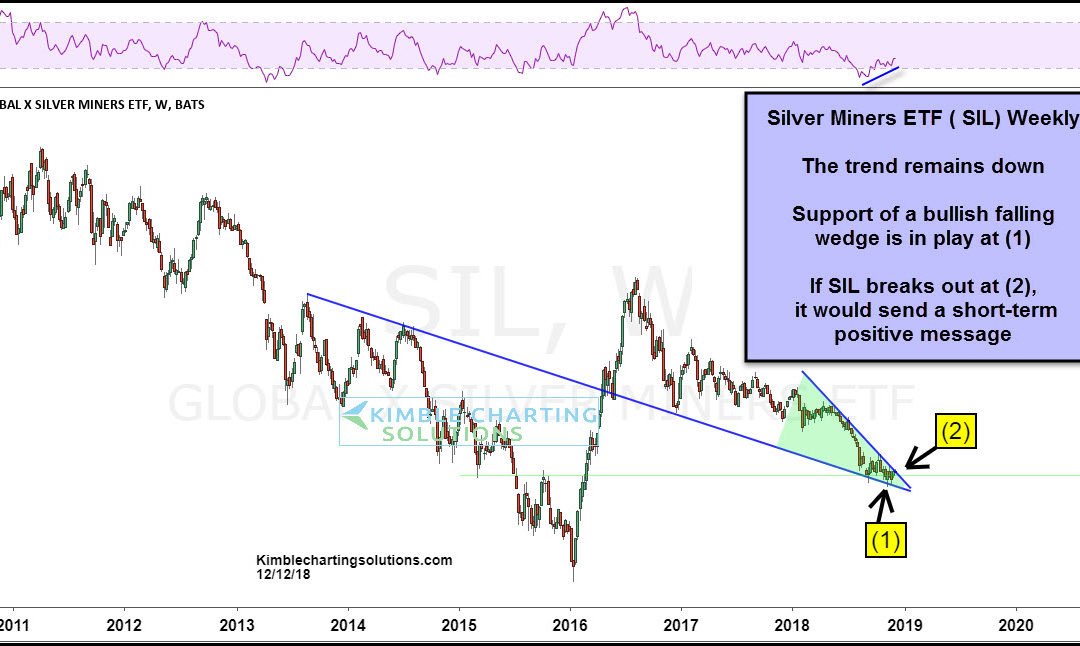
by Chris Kimble | Dec 12, 2018 | Kimble Charting
Silver miners (SIL) have had a rough 7-years, as the ETF finds itself nearly 75% below its 2011 highs. No doubt the long-term trend remains down. SIL is has declined 27% since the first of this year (See chart below), where it is testing a falling support line at (1),...
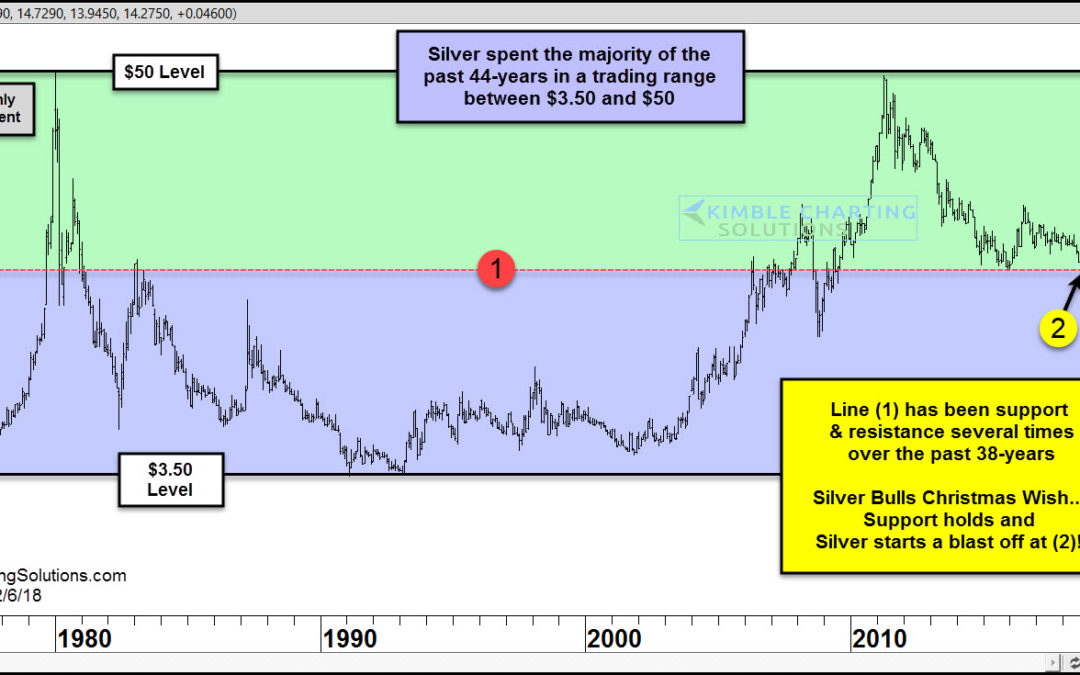
by Chris Kimble | Dec 7, 2018 | Kimble Charting
Silver is nearing an important price juncture and is likely to break up or down in the days / weeks ahead. And, as we discussed earlier, that move should be a big one! Though Silver (NYSEARCA: SLV) has been known to buck the trend before (see prior article link), it...
