
by Chris Kimble | Aug 19, 2015 | Global Dashboard, Kimble Charting
The broad markets (S&P 500 & NYSE) have been diverging against the Advance/Decline line since May. Why did this start in May? Below looks at the NYSE A/D line, based upon Common stocks only. The line peaked in May and has been diverging since. CLICK ON CHART...

by Chris Kimble | Sep 23, 2014 | Kimble Charting
CLICK ON CHART TO ENLARGE The above 6-pack update the patterns on some of the larger stock markets around the world. As you can see Germany and the S&P 500 are these strongest of this set, as both are well above their highs reached in 2000 & 2007. As...

by Chris Kimble | Aug 12, 2014 | Kimble Charting
CLICK ON CHART TO ENLARGE Over the past few years, Europe has had strong rallies, which have formed rising wedges. Two thirds of the time this pattern leads to lower prices. Of late support lines could be breaking in France, London & Germany. On the...
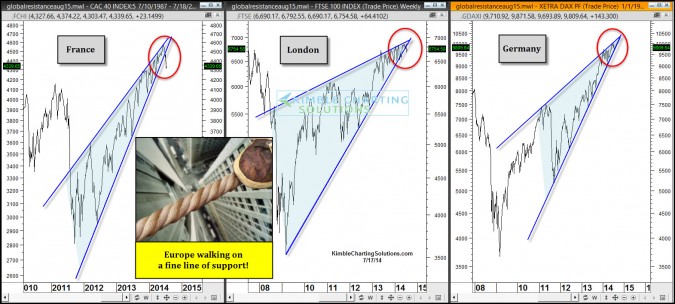
by Chris Kimble | Jul 17, 2014 | Kimble Charting
CLICK ON CHART TO ENLARGE The strong rallies in London, Germany & France over the past few years has created steep bearish rising wedges, which two-thirds of the time result in lower prices. No doubt the trend is up on all three of these key markets! Are...

by Chris Kimble | Nov 19, 2013 | Kimble Charting
CLICK ON CHART TO ENLARGE What does the French, London, Hang Seng, China, S&P 500 & German stock markets have in common? The answer isn’t that they are all at all-time highs! What they all have in common is that each are attempting to breakout of...

by Chris Kimble | Feb 4, 2013 | Kimble Charting
Much attention is being directed towards the S&P 500, as it nears its 2007 highs. From a performance perspective over the past 6 month, the chart below reflects the S&P 500 is very weak, compared to key global markets. CLICK ON CHART TO ENLARGE In the...

by Chris Kimble | May 22, 2011 | Kimble Charting
Global markets on a high wire? CLICK ON CHART TO ENLARGE Global markets remain in a very tricky situation, per the vast majority of them are setting on support lines at the same time. Last weekend I ran a post titled “Look Alikes, Domino’s and...
