
by Chris Kimble | Aug 12, 2014 | Kimble Charting
CLICK ON CHART TO ENLARGE Over the past few years, Europe has had strong rallies, which have formed rising wedges. Two thirds of the time this pattern leads to lower prices. Of late support lines could be breaking in France, London & Germany. On the...

by Chris Kimble | Jan 28, 2014 | Kimble Charting
CLICK ON CHART TO ENLARGE My Mentor, Sir John Templeton, was a strong believer in “buy at the point of maximum pessimism!” Unless you live under a rock, you are well aware that Emerging markets have not only had a few rough years, they’ve also...
by Chris Kimble | Jan 15, 2014 | Kimble Charting
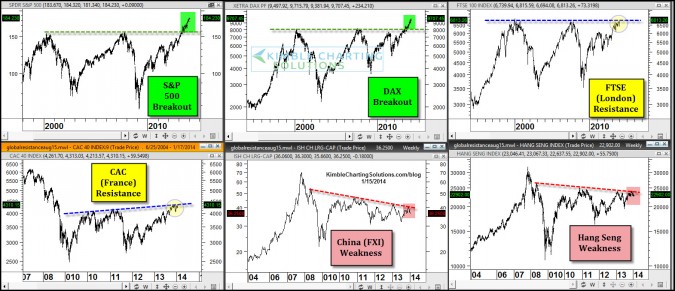
CLICK ON CHART TO ENLARGE The above 6-pack reflects some of the key global markets and where they stand from a pattern perspective. Strength is taking place in the S&P 500 & Dax as breakouts above 2000 & 2007 highs continue. Key resistance is...
by Chris Kimble | Oct 21, 2013 | Kimble Charting
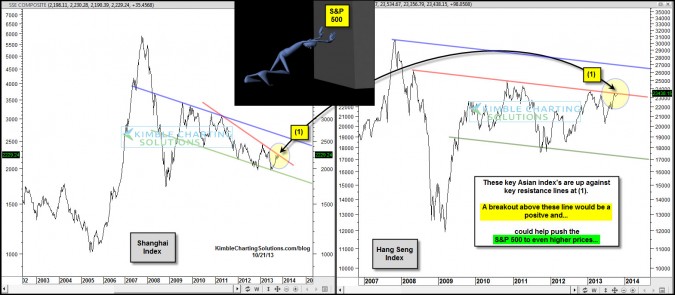
CLICK ON CHART TO ENLARGE 2013 hasn’t been kind to all stock index’s, especially when it comes to key Asian stock markets! The chart below reflects that the Hang Seng and the Shanghai Index are lagging the S&P 500’s performance by a large margin...
by Chris Kimble | Oct 3, 2013 | Kimble Charting
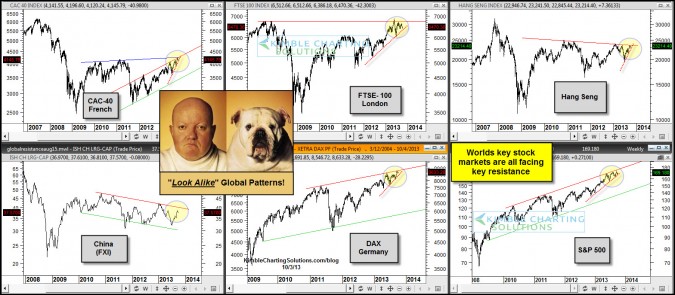
CLICK ON CHART TO ENLARGE When you take a look around the world, key stock markets all are facing resistance with several of them creating bearish rising wedge patterns that suggest lower prices take place two-thirds of the time! –...
by Chris Kimble | Jul 3, 2013 | Kimble Charting
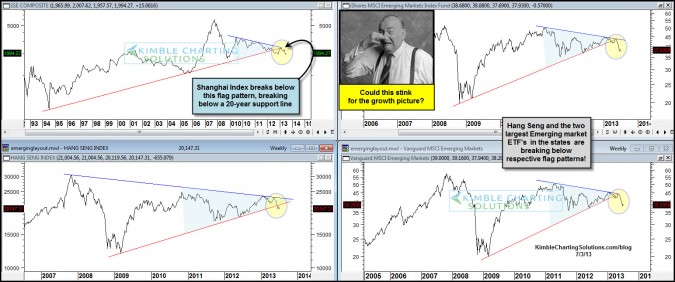
CLICK ON CHART TO ENLARGE Could a slow down in China not only impact other Emerging markets, could it ripple in the U.S.? The above 4-pack reflects that the Shanghai index is breaking support of a multi-year flag pattern, with the bottom of the flag pattern, being a...
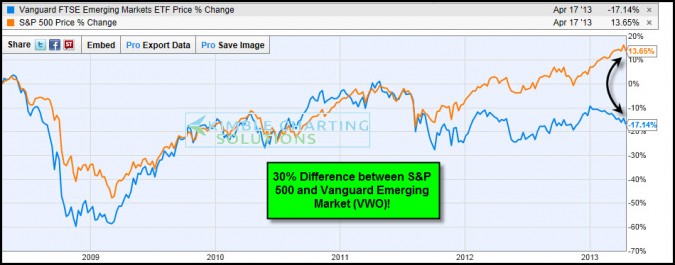
by Chris Kimble | Apr 18, 2013 | Kimble Charting
CLICK ON CHART TO ENLARGE Emerging markets are the growth engines of the world? Heard this pitch for years? Could this pitch be the reason that 2 of the 4 largest ETF’s in the world are Emerging markets ETF’s, despite relative weak performance...

by Chris Kimble | Mar 21, 2013 | Kimble Charting
CLICK ON CHART TO ENLARGE 35% of the blogs viewership is from outside of the United States, reflected in the chart below. I am deeply humbled by the global viewers that come to the blog daily. Thank you. The above 6-pack reflects that the DAX, CAC-40 &...
