
by Chris Kimble | Dec 30, 2015 | Kimble Charting
The Hang Seng Index of late has broken below support line (1) in the chart below. This support line has been in play for the past 35-years. The Power of the Pattern is of the opinion that a key kiss of resistance could be in play and what takes place from here, could...

by Chris Kimble | Aug 24, 2015 | Kimble Charting
I don’t think I will be telling you anything new when I share that a global sell off in stocks is taking place the past few days. If I were to have shared that the Euro would be a safe haven currency last week before stocks sold off, what would you have...
by Chris Kimble | Aug 5, 2015 | Kimble Charting
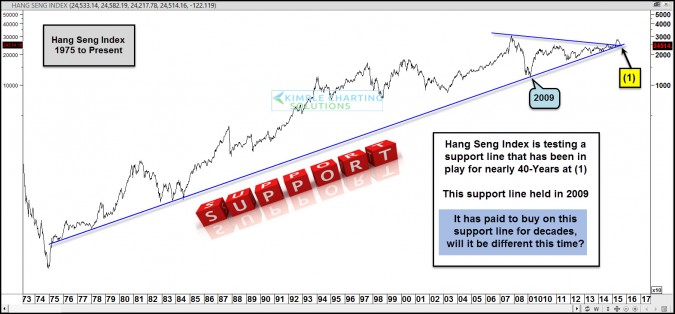
CLICK ON CHART TO ENLARGE The Hang Seng Index is now testing a support line that has been in play for nearly 40-years. From a technical analysis perspective, few times do you see a single support line that has been in play this long and tested multiple times for...

by Chris Kimble | Apr 8, 2015 | Kimble Charting
CLICK ON CHART TO ENLARGE This chart takes a look at the Shanghai Index over the past couple of decades. As you can see, this index remains inside of a well defined rising channel over the past 20-years. From 2007 to 2014 this index had little to brag about, as it...

by Chris Kimble | Apr 6, 2015 | Kimble Charting
Is an important Paradigm Shift about to take place? Could be! For the past few years, the S&P 500 has been a much better asset to own when comparing performance against China, Hong Kong, Japan, South Korea and Emerging Markets. The 6-pack below looks at 5-ratios...

by Chris Kimble | Feb 19, 2015 | Kimble Charting
CLICK ON CHART TO ENLARGE Happy Lunar New Year to all viewers, especially those from China. Wishing all of you a very prosperous year ahead. The chart above takes a look at the Hang Seng Index since 1965. The index remains above 40-year support line (1). Over the past...

by Chris Kimble | Oct 7, 2014 | Kimble Charting
This morning the IMF lowered its forecast for global growth. Are they attempting to lower the bar on expectations going forward? Do they know something we don’t? Should one pay attention to forecasts or prices? CLICK ON CHART TO ENLARGE The...

by Chris Kimble | Sep 23, 2014 | Kimble Charting
CLICK ON CHART TO ENLARGE The above 6-pack update the patterns on some of the larger stock markets around the world. As you can see Germany and the S&P 500 are these strongest of this set, as both are well above their highs reached in 2000 & 2007. As...
