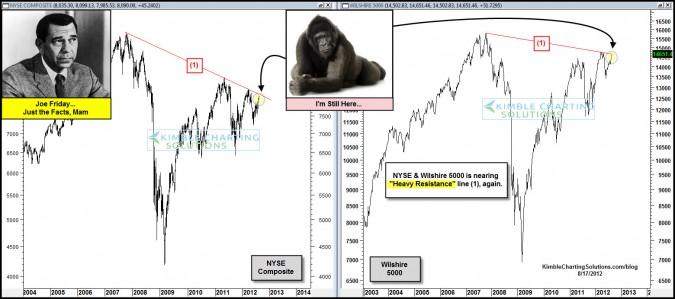
by Chris Kimble | Aug 17, 2012 | Kimble Charting
CLICK ON CHART TO ENLARGE Two of the broadest market index’s in the United States are back at resistance that has stopped their rallies over the past few years. Can these key markets push aside the 800 pound gorilla? Is the U.S. broad markets the only...

by Chris Kimble | Aug 15, 2012 | Kimble Charting
CLICK ON CHART TO ENLARGE The Hang Seng Index and China ETF (FXI) have been rather weak over the past year, after breaking from their flag/pennant patterns. Of late their counter trend rallies have them testing falling resistance, based upon a series of lower highs....

by Chris Kimble | May 12, 2011 | Kimble Charting
CLICK ON CHART TO ENLARGE How interesting that the Shanghai index and the 500 index are setting on support, dating back to the 2009 lows, at the same time! Sure glad these markets aren’t highly correlated!!! Flag patterns suggest a big move is...

by Chris Kimble | Oct 28, 2010 | Kimble Charting
Dow Jones and the Hang Seng Index have both rallied up to key resistance at the 61% Fibonacci level, in the chart below. Notice what is happening to the Hang Seng index at (1)! CLICK ON CHART TO ENLARGE Hang Seng index is breaking down at (1). Watch this global...


