
by Chris Kimble | Aug 13, 2013 | Kimble Charting
CLICK ON CHART TO ENLARGE A wide variety of bonds have been under pressure since their May highs. This doesn’t just apply to Government bonds! The above 4-pack reflects a cross section of bonds (Govt, High Quality Corp & Junk Bonds) that have been weak...

by Chris Kimble | Aug 5, 2013 | Kimble Charting
CLICK ON CHART TO ENLARGE The above inset chart reflects its been a tough year for junk Bond ETF JNK, as it’S NAV return is in the red at this time, while the S & P 500 is up nearly 20% on a YTD basis. At this time JNK could well be creating a bearish...

by Chris Kimble | Jul 15, 2013 | Kimble Charting
CLICK ON CHART TO ENLARGE Junk Bonds ETF’s JNK & HYG both broke below their 50 & 200 EMA lines back in May and declined around 7% from high to lows. They are often considered leaders of the stock market. Could it be important for them to climb back above...

by Chris Kimble | Jun 25, 2013 | Kimble Charting
CLICK ON CHART TO ENLARGE The Effective yield on High yield bonds (Junk bonds) are at historical lows at this time. Over the past 6 years, when the yield broke above resistance of bullish falling wedges, the S&P 500 ended up declining between 17% & 50%. ...

by Chris Kimble | Jun 13, 2013 | Kimble Charting
CLICK ON CHART TO ENLARGE The Power of the Pattern shared that Junk Bond ETF’s were creating bearish rising wedges on 5/24, suggesting a two-thirds chance junk bonds would fall in price. (see post here) The above 2-pack reflects a breakdown in price and a...

by Chris Kimble | Jun 3, 2013 | Kimble Charting
CLICK ON CHART TO ENLARGE Support is support until broken. Junk bond ETF (JNK) has underperformed the S&P by 5% over the past 30 days. This decline has it setting on a trio of support. If JNK breaks support on a weekly closing basis, odds increase it...
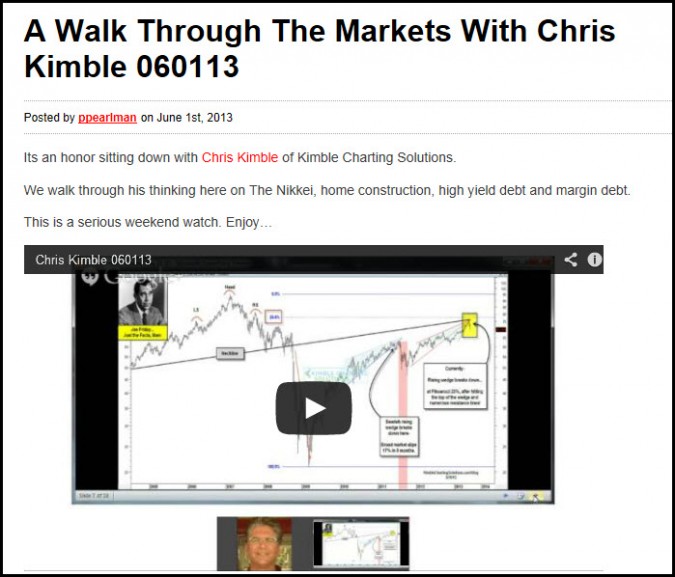
by Chris Kimble | Jun 1, 2013 | Kimble Charting
CLICK HERE TO WATCH INTERVIEW We discuss why we are shorting the Nikkei (EWV up 20% in 8 Days), what message Lumber and home builders is sending, Double top in the NYSE with margin debt in the danger zone, new Eiffel Tower patterns forming and break downs in Kimble...
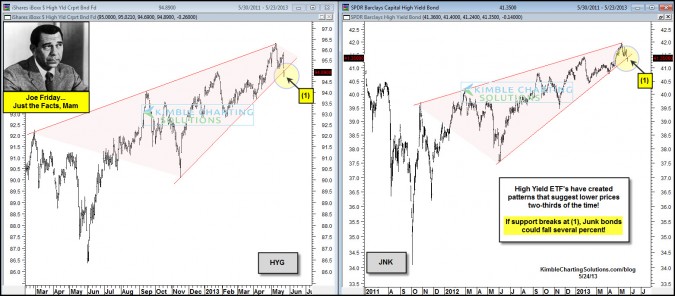
by Chris Kimble | May 24, 2013 | Kimble Charting
CLICK ON CHART TO ENLARGE High Yield ETF’s JNK & HYG have formed bearish rising wedges, that suggest two-thirds of the time prices will end up lower in the future. Support line of the rising wedge is being tested very hard/starting to give way right...
