
by Chris Kimble | Jun 2, 2014 | Kimble Charting
CLICK ON CHART TO ENLARGE The table below reflects that India has been doing very well so far this year, as its up 26%. That puts it 22% above the S&P 500 this year and 24% better than EEM, a popular Emerging markets ETF. CLICK ON CHART TO ENLARGE The top...
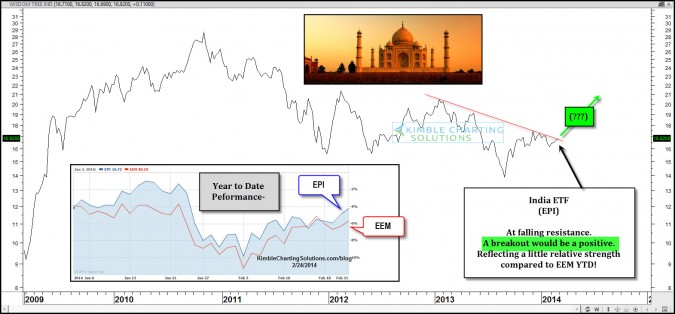
by Chris Kimble | Feb 24, 2014 | Kimble Charting
CLICK ON CHART TO ENLARGE Its been a rough few years for Emerging markets and India is no exception! From a shorter-term view India ETF (EPI) is reflecting some relative strength compared to EEM year to date, which has now brought it up against a year long...
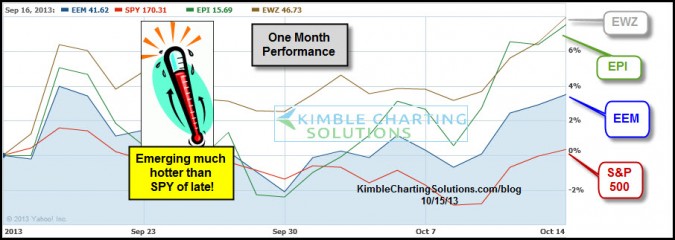
by Chris Kimble | Oct 15, 2013 | Kimble Charting
CLICK ON CHART TO ENLARGE Yes the S&P 500 is within a small percentage of new all-time highs, which is a great sign for the markets and portfolios. Could the shut down in Washington end at any moment and push the S&P 500 higher? Of late though, what has...

by Chris Kimble | Mar 26, 2013 | Kimble Charting
The 6-pack below reflects that BRIC ( Brazil, Russia, India & China) and Emerging markets are close to or are breaking key support lines. CLICK ON CHART TO ENLARGE Many pundits continue to tell us that Emerging markets are the growth engine of the...

by Chris Kimble | Mar 19, 2013 | Kimble Charting
CLICK ON CHART TO ENLARGE The India ETF (EPI) formed a multi-month flag pattern, broke support and the rally over the past few weeks has it kissing the underside of the flag pattern as resistance at (1). If EPI fails to get back above resistance, I would want to...

by Chris Kimble | Jan 16, 2013 | Kimble Charting
Eiffel tower patterns can be painful to an asset!!! Last November, when Apple was trading over $600 per share, the Power of the Pattern reflected that Apple could be in the early stages of an Eiffel Tower pattern. (see post here) The 4-pack below reflects Eiffel...

by Chris Kimble | Dec 17, 2012 | Kimble Charting
Is Santa Claus bringing good cheer to the Emerging markets complex this year? The chart below reflects that BRIC ETF’s/Emerging markets are reflecting relative strength compared to the S&P 500 over the past 60 days. CLICK TO ENLARGE The 4-pack below reflects...

by Chris Kimble | Sep 5, 2012 | Kimble Charting
We’ve heard that the BRIC countries (Brazil, Russia, India & China) are to be the growth engines of the world for several years now. I believe in time they will, yet once the Shanghai Index broke below its multi-year flag pattern, they have all...
