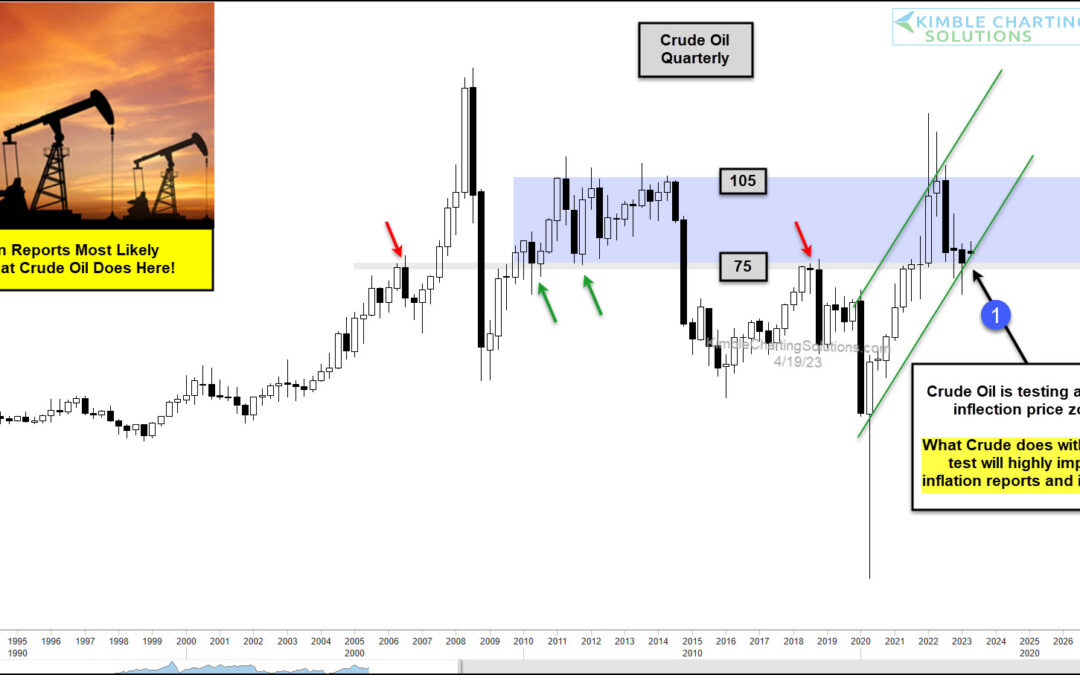
by Chris Kimble | Apr 21, 2023 | Kimble Charting
Inflation concerns peaked last year when agriculture and oil prices peaked. This year has seen inflation fears subside as key price inputs fall. BUT investors should not be complacent. Inflation risks remain. Today, we look at a “quarterly” chart of Crude Oil to...
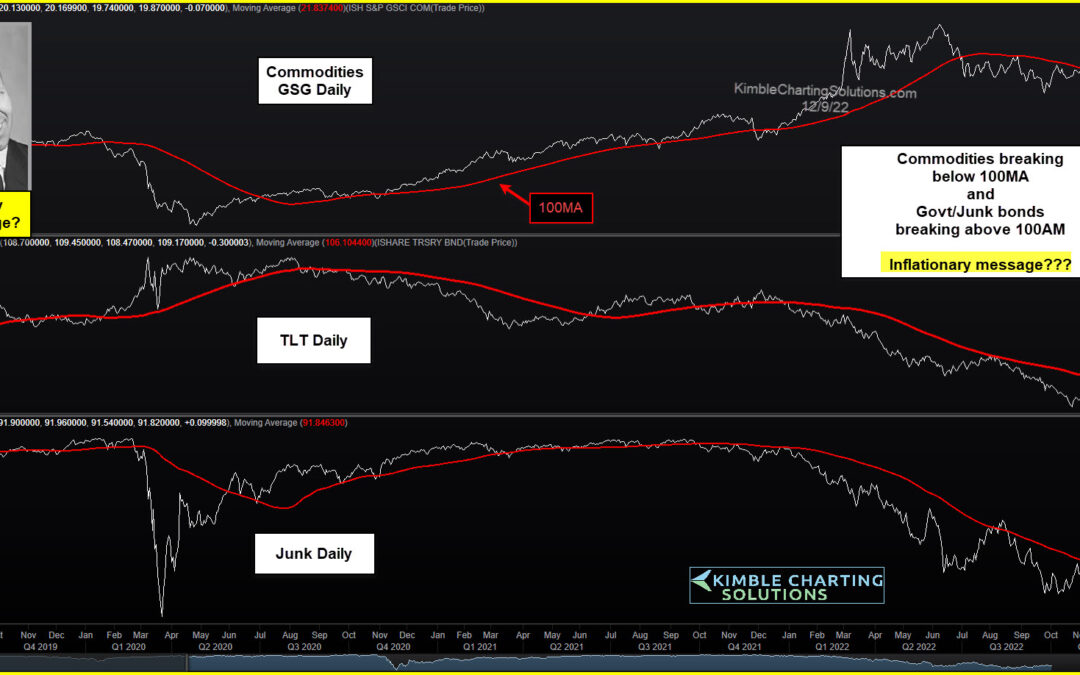
by Chris Kimble | Dec 13, 2022 | Kimble Charting
The financial markets have been volatile this year, to say the least. And much of the volatility has been tied to inflationary concerns and rising interest rates via the Federal Reserve. That said, we’ve come to a point in time where it appears that inflation may be...
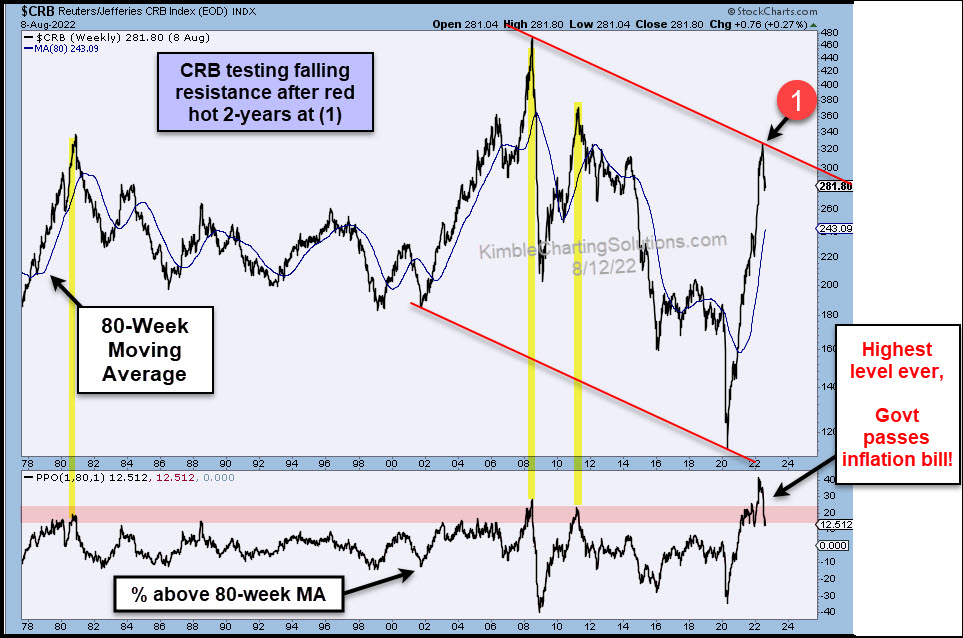
by Chris Kimble | Aug 12, 2022 | Kimble Charting
It’s fair to say that inflation has been one of the key economic buzzwords of 2022 (along with interest rates). Will the Federal Reserve’s last two big rate hikes help? Will the latest government inflation bill matter? Perhaps. But one key ingredient may have peaked a...
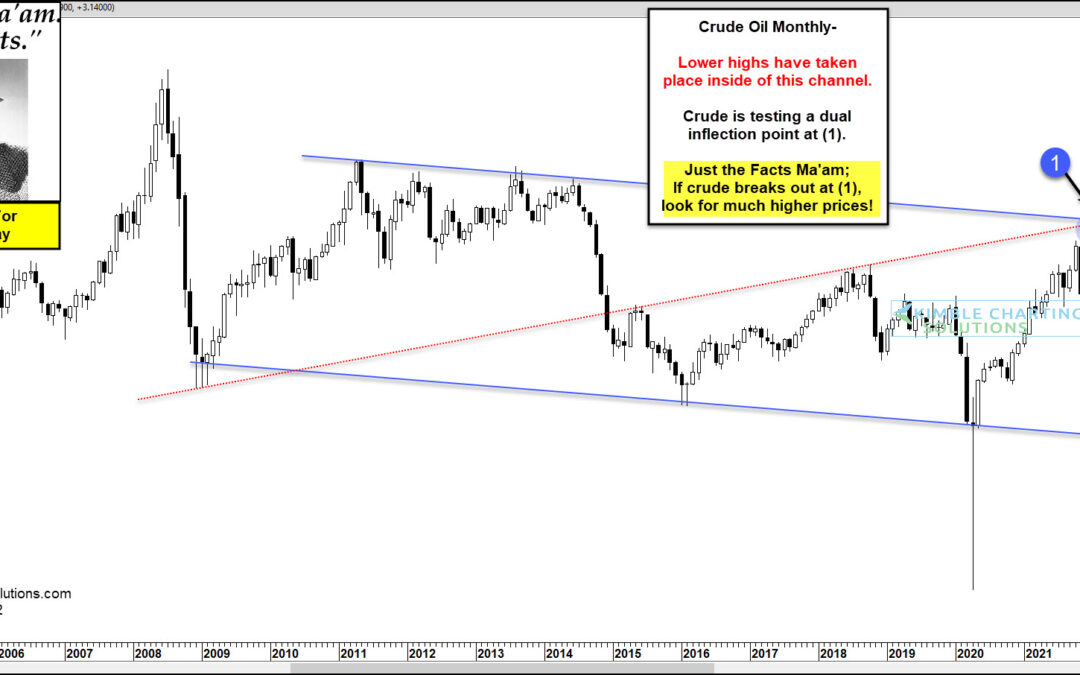
by Chris Kimble | Feb 11, 2022 | Kimble Charting
Inflation has been a growing worry for investors and consumers alike. And Thursday’s Consumer Price Index (CPI) data didn’t help, showing a 7.5% spike higher. One area that has consumers concerned is energy prices… and they have been rising for several months. And,...
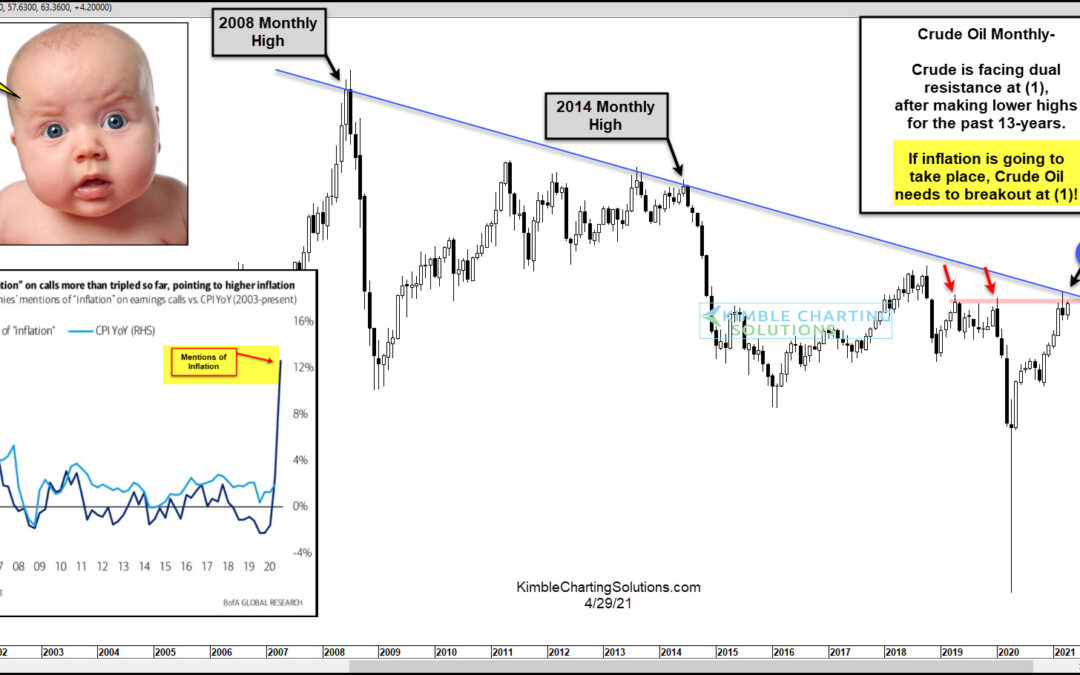
by Chris Kimble | Apr 29, 2021 | Kimble Charting
Commodities prices have risen rather sharply over the past 12-18 months, adding to worries of pricing pressure and inflation. As you can see in the chart above, businesses are taking note. The word “inflation” is being mentioned at a record rate by S&P 500...
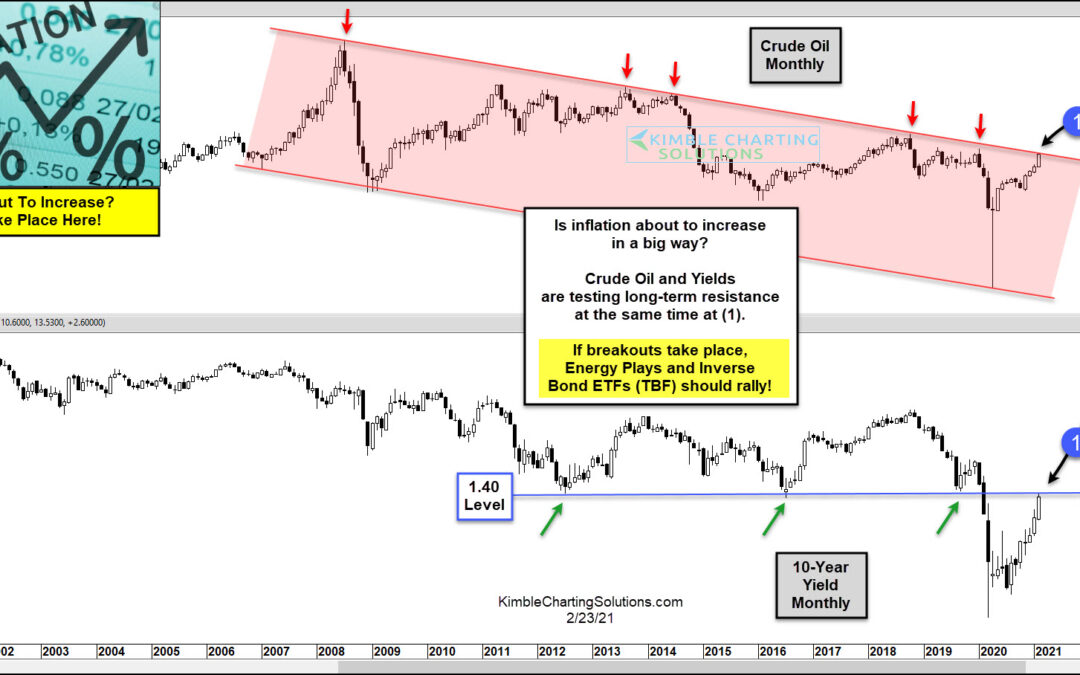
by Chris Kimble | Feb 24, 2021 | Kimble Charting
Inflation seems to be a thing of the past… but current trading in bond and commodity markets tell us that it could become a thing of the future! Inflation hasn’t been an issue, or even on our radar, since the 1980s. Sure, the 2007 surge in oil prices offered some...

by Chris Kimble | Jun 16, 2017 | Kimble Charting
Post election the investment community was strong on the belief that the new administration was going to get the economy to grow and that inflation will pick up. Below looks at the Growth/Inflation indicator ratio, which is created by using TIP/TLT ratio. CLICK ON...
by Chris Kimble | May 31, 2017 | Kimble Charting
The economy continues to do well, along with the stock market, prompting many to be concerned about inflationary pressures picking up speed. Below looks at the TIP/TLT ratio and the message it is sending about inflationary pressures, or lack of. CLICK ON CHART TO...
