
by Chris Kimble | Dec 9, 2016 | Kimble Charting
Below looks at the patterns on the S&P 500 and the Yield on the 10-year note (Inverted to look like bond prices), since the late 1980’s. A rare test of support and resistance by stocks and bonds, is in play right now! CLICK ON CHART TO ENLARGE The S&P...

by Chris Kimble | Jan 8, 2015 | Kimble Charting
CLICK ON CHART TO ENLARGE 30-year yields could be at a triple bottom and the 10-year yield could be making a bullish inverse head and shoulders pattern/creating bullish wicks at the right shoulder. Seem unlikely? I understand if you think so. If you would like...

by Chris Kimble | Sep 12, 2014 | Kimble Charting
CLICK ON CHART TO ENLARGE The Power of the Pattern suggested that interest rates were about to blast off in May of 2013, because it looked like a bullish inverse head & shoulders pattern in yields was in play. (see post here) What happened right...

by Chris Kimble | May 15, 2014 | Kimble Charting
CLICK ON CHART TO ENLARGE The chart above is a 100-year look at yields on AAA Corporate Bonds. A couple of things jump out at me. Yields remain inside of a well established 30-year downtrend (lower highs and lower lows) and the rally in yields in 2013 did NOT...
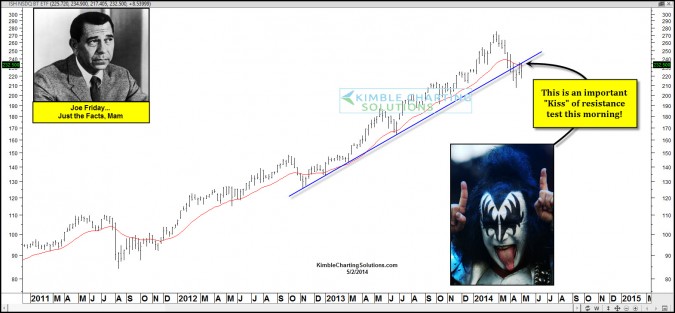
by Chris Kimble | May 2, 2014 | Kimble Charting
CLICK ON CHART TO ENLARGE Bio Tech has had its positive influence to the broad markets over the past couple of years. It seemed to have had a negative influence on the markets from Feb 27th to April the 15th, where a bullish wick took place in the sector and a...

by Chris Kimble | Jan 8, 2014 | Global Dashboard, Kimble Charting
The Power of the Pattern suggested interest rates were about to blast off in May of last year (See post here) Since that post the yield on the 10-year note is up 80%! Below is the performance of interest sensitive assets & the S&P 500 since that...

by Chris Kimble | Nov 7, 2013 | Kimble Charting
CLICK ON CHART TO ENLARGE Recently King Dollar found it self on multi-year support, created a bullish falling wedge and very few investors were bullish the U.S. Dollar. This was a set up for a rally in King Dollar! The Power of the Pattern and Joe Friday highlighted...

by Chris Kimble | Sep 6, 2013 | Kimble Charting
CLICK ON CHART TO ENLARGE Dual multi-year channel resistance comes into play in the 10-year rate at (1) in the chart above. The rally in yields has been brutal to the price of bonds, since last summer, as the yield on the 10-year notes is up 100%! Joe...
