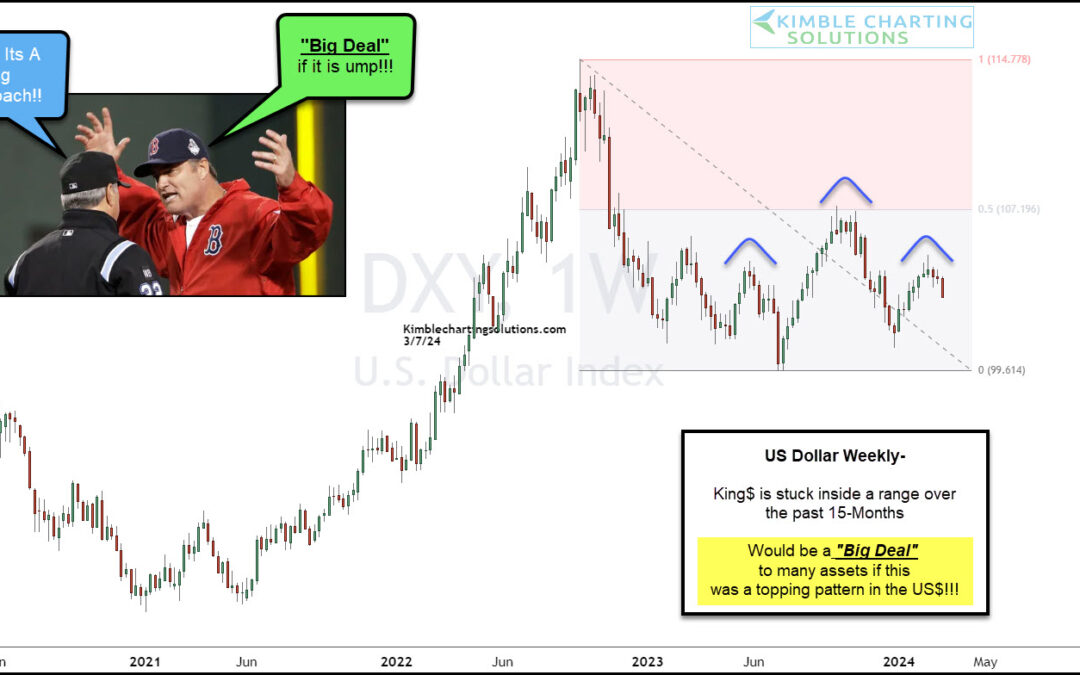
by Chris Kimble | Mar 11, 2024 | Kimble Charting
The U.S. Dollar continues to be the most powerful currency in the world. And for this reason, it’s also the most watched. When the dollar is on the move, it can have an effect on the various asset classes. Today we look at a “weekly” chart of the old King Dollar. And...
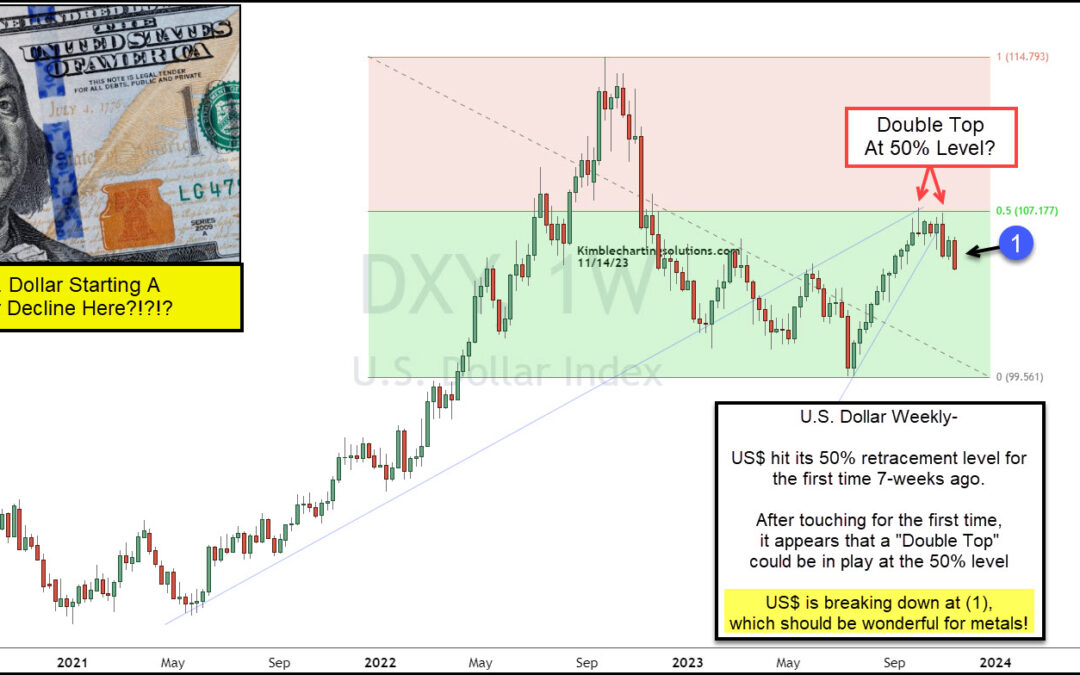
by Chris Kimble | Nov 15, 2023 | Kimble Charting
A couple of weeks ago, we highlighted the U.S. Dollar as an asset ready for a big move. King Dollar was trading sideways and at important price resistance, so something had to give. Today, we revisit that “weekly” chart and provide an update on where the buck stands....
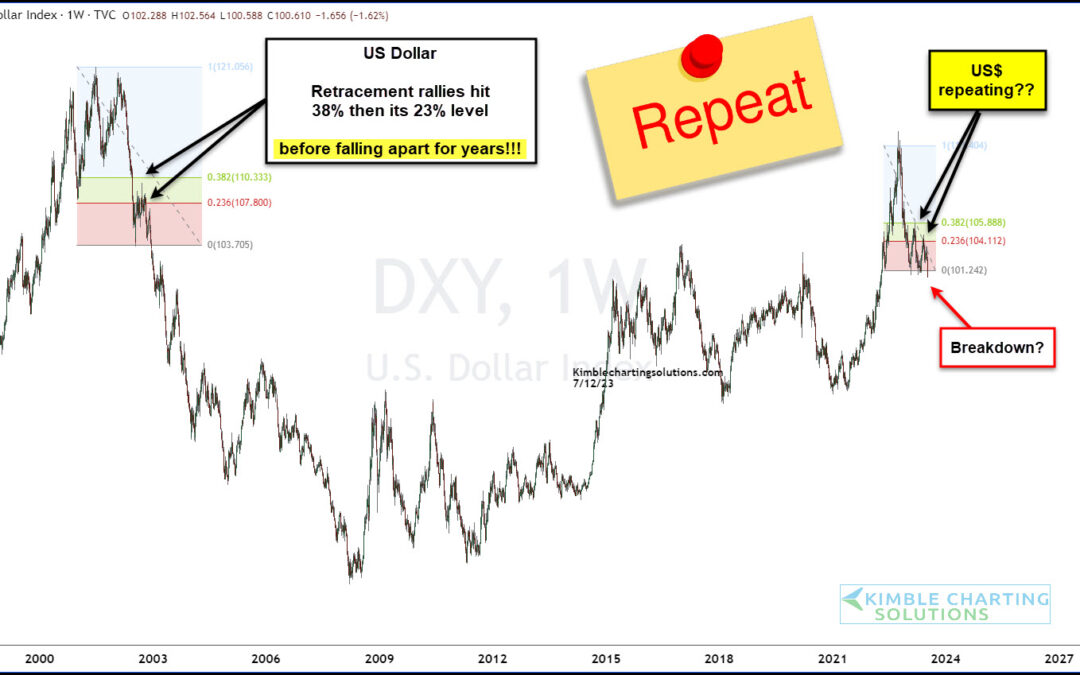
by Chris Kimble | Jul 19, 2023 | Kimble Charting
Recent weakness in the US Dollar has helped to propel commodities such as Gold and Silver higher. Today’s analysis showing a potential repeating pattern that could mean significantly more weakness for King Dollar… but only if triggered. Below is a “weekly” chart of...
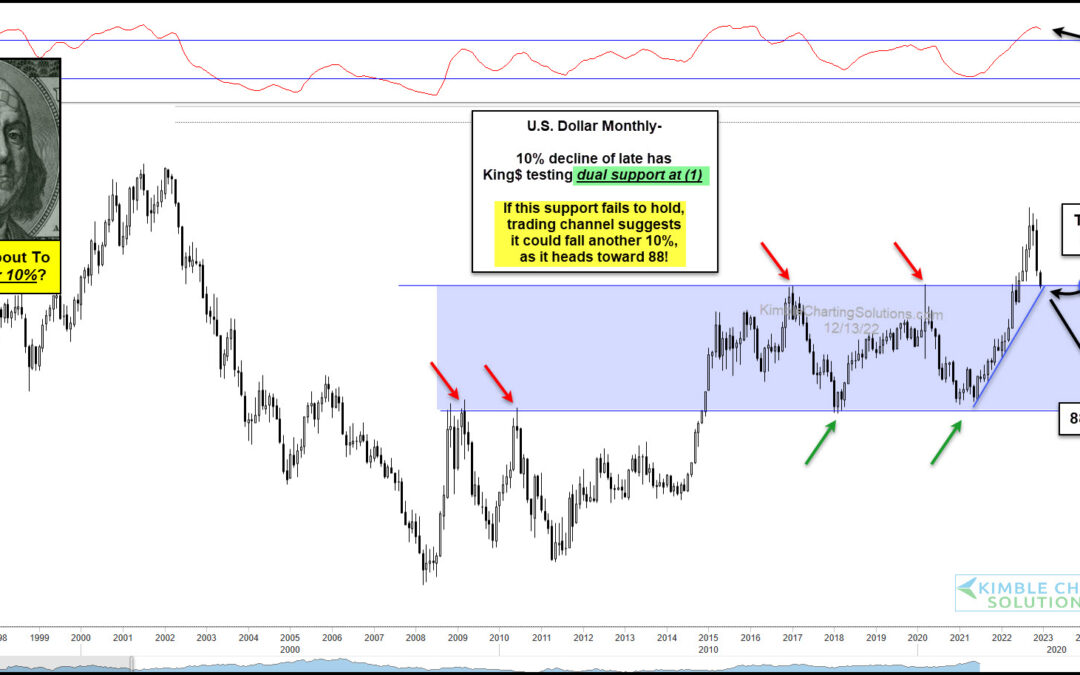
by Chris Kimble | Dec 14, 2022 | Kimble Charting
If you haven’t already learned, the financial markets can change on a dime. Trends and themes are good until they are not. This is why we use technical analysis to alert us when price is reversing or at risk of reversing. Today we turn out attention to the US Dollar...
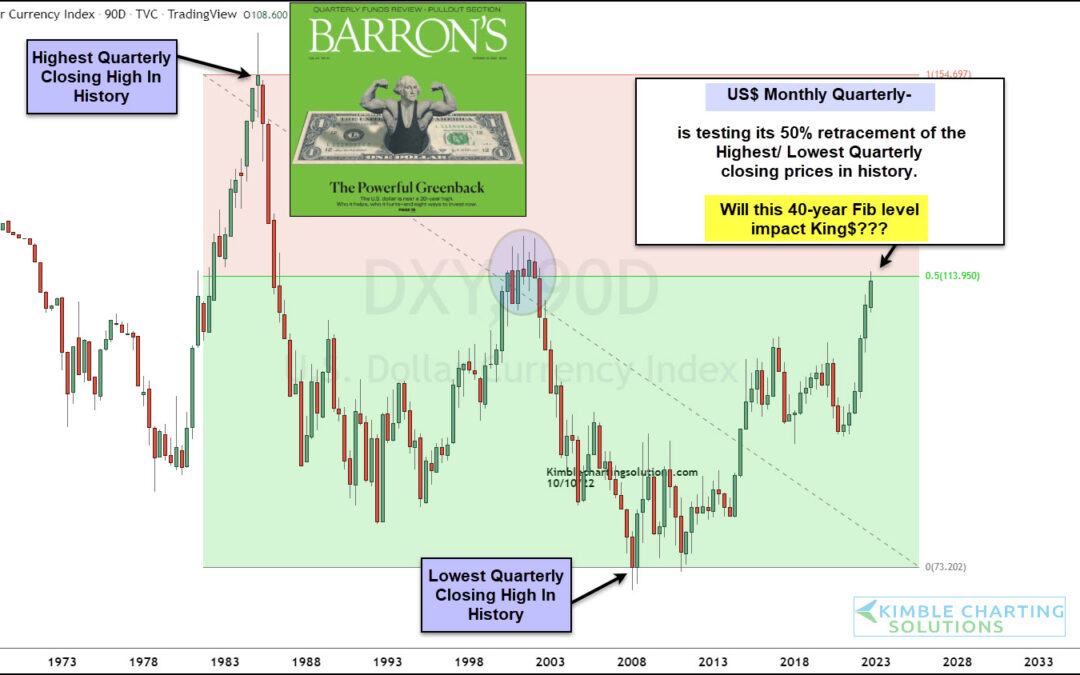
by Chris Kimble | Oct 11, 2022 | Kimble Charting
The US Dollar Index has propelled higher out of a double bottom formation that began in 2008… and nothing has slowed down King Dollar for nearly 14 years. The latest show of strength in the US Dollar has the financial markets on edge. After all, the Forex is the...
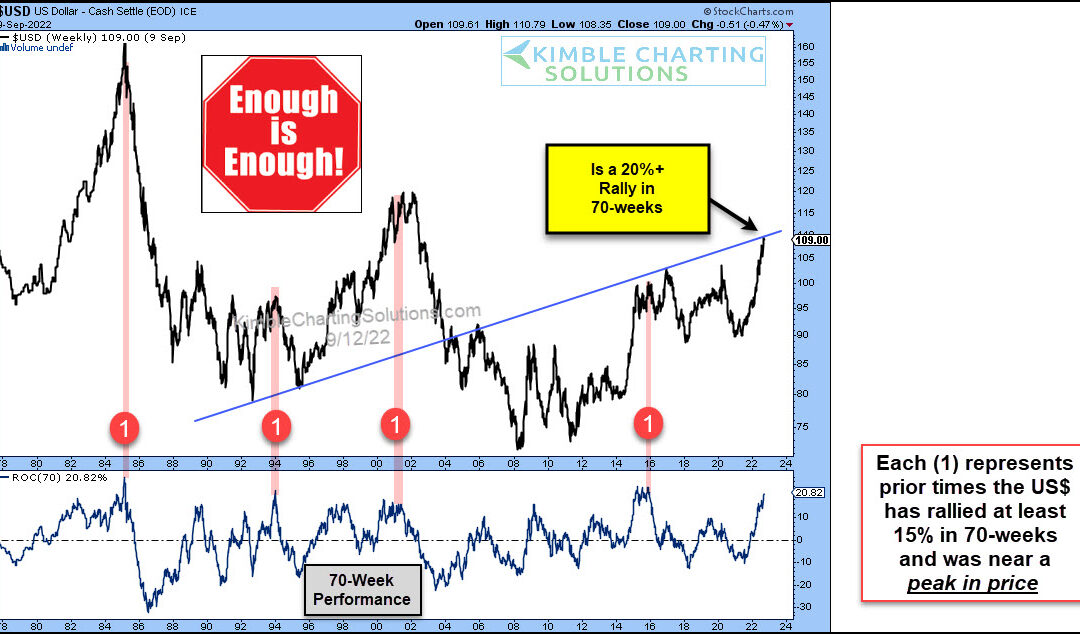
by Chris Kimble | Sep 13, 2022 | Kimble Charting
The US Dollar is strengthening along side rising interest rates. In fact, both are rocketing higher as inflation takes root and the European economy (and the Euro) weakens. Today we look for clues via the long-term “weekly” chart of the US Dollar Index. As you can...
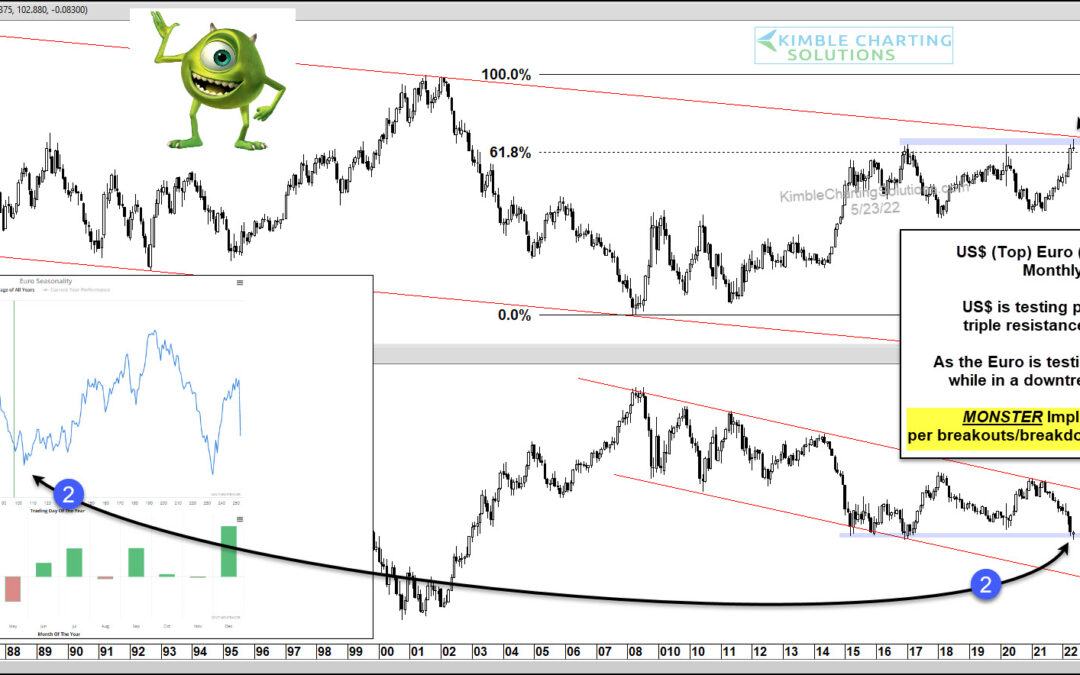
by Chris Kimble | May 23, 2022 | Kimble Charting
The past several months has seen the US Dollar Index rally once more, pushing King Dollar up to a retest of multi-year highs. At the same time, the Euro has been sputtering and is nearing multi-year lows. In today’s long-term “monthly” chart 2-pack, we look at both...
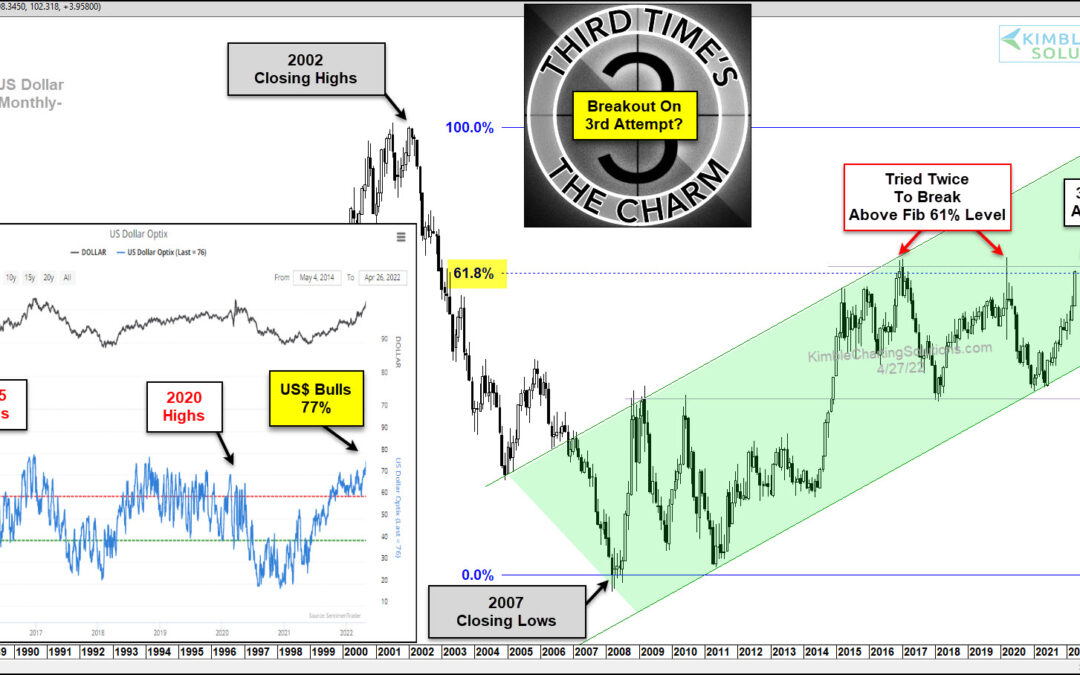
by Chris Kimble | Apr 28, 2022 | Kimble Charting
The US Dollar currency has rallied sharply over the past year. Is it time to give King Dollar his crown back? Looking at today’s long-term chart, we can see that the US Dollar has traded in a broad rising channel since the 2007 low. And the 2015 and 2020 highs formed...
