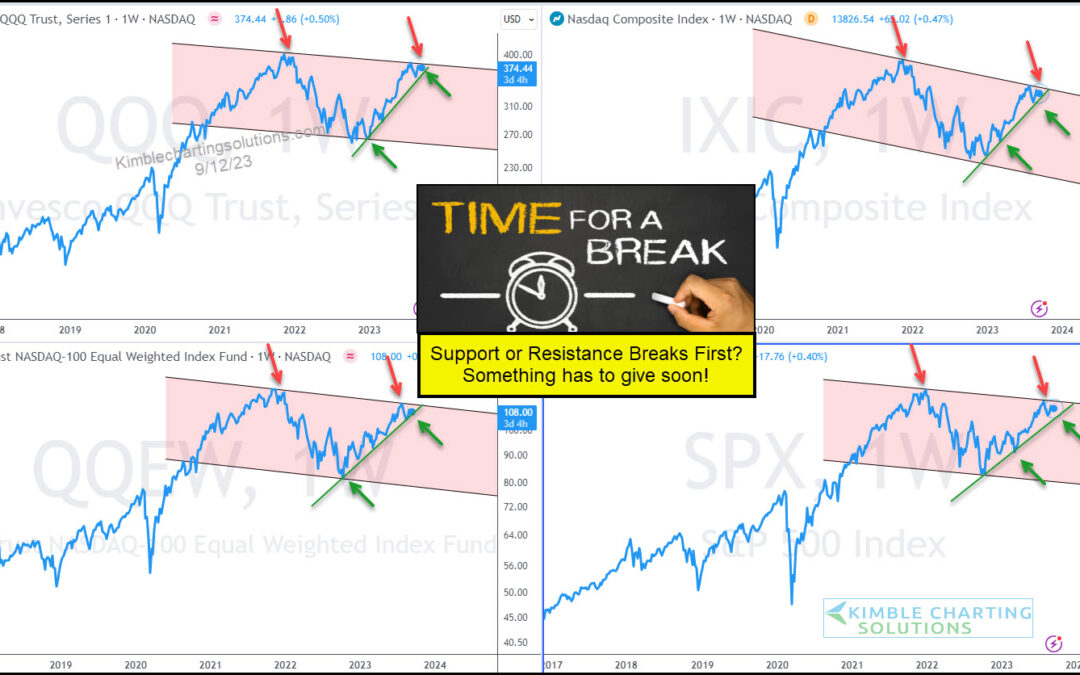
by Chris Kimble | Sep 13, 2023 | Kimble Charting
Without a doubt, technology stocks are the leader within global stock markets and the global economy. So when the technology sector nears a major trend decision point, investors and consumers should be watching! And that is exactly what we have on display today, as...
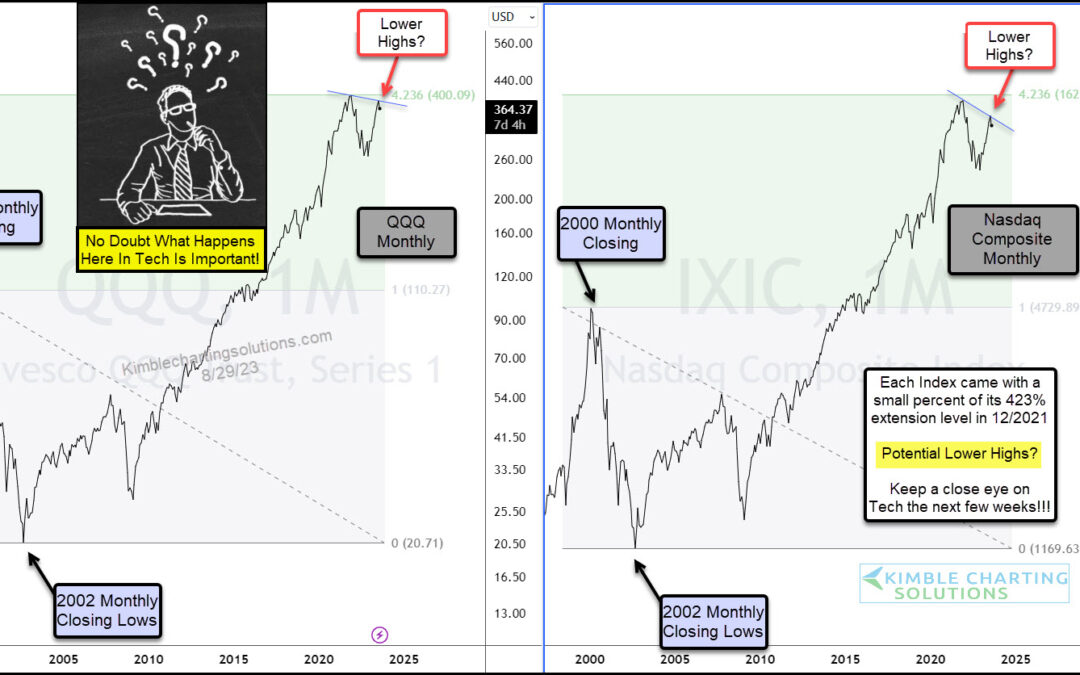
by Chris Kimble | Aug 30, 2023 | Kimble Charting
Several stock market indices and sectors are nearing important trading points within various patterns. But arguably none more important than the major technology indices. Today we highlight the Nasdaq 100 ETF (QQQ) along with the Nasdaq Composite Index. As you can...
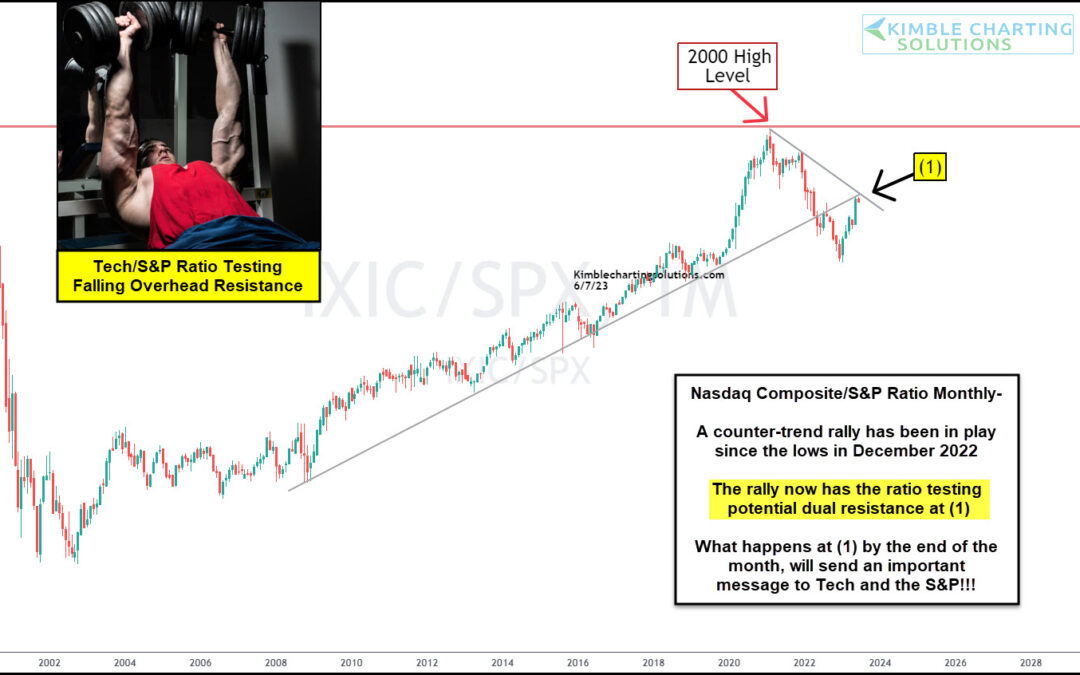
by Chris Kimble | Jun 8, 2023 | Kimble Charting
The dot com crash was brutal. But even in the demise of several tech stocks, investors knew that technology was our future. And for the past 20 years technology stocks have been outperforming the broader market and leading the major stock market indices higher. This...
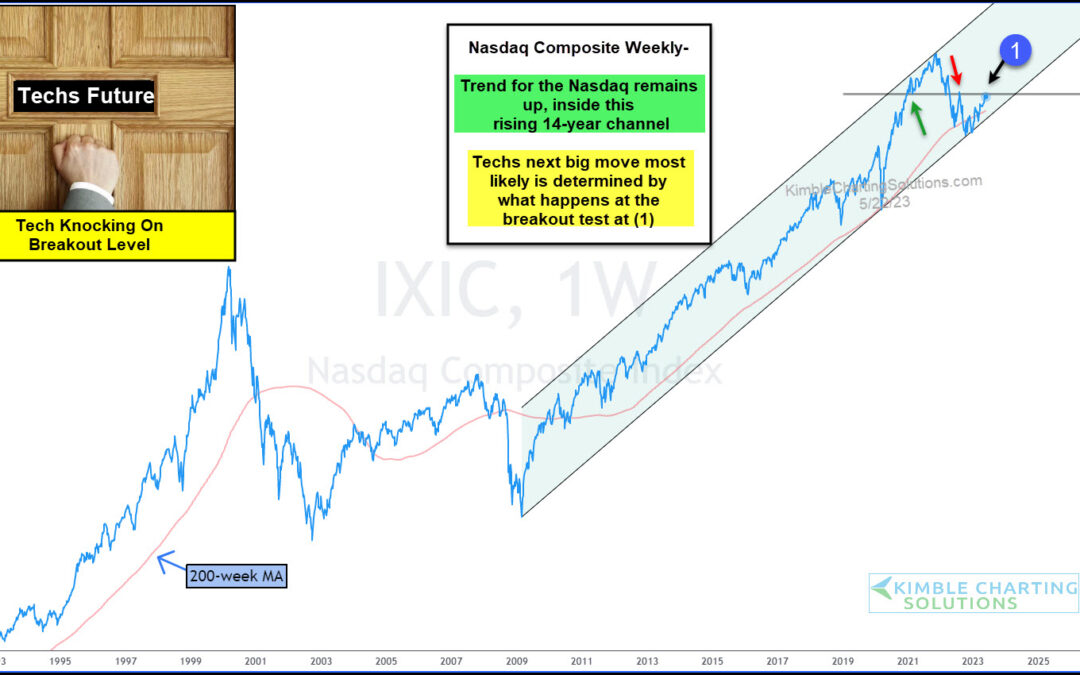
by Chris Kimble | May 24, 2023 | Kimble Charting
Technology stocks continue to lead the broader market higher. Without them, who knows where the stock market would be!! Today’s chart highlights Tech’s leadership, along with it’s long-term rising trend. Below you will see a “weekly” chart of the Nasdaq Composite. As...
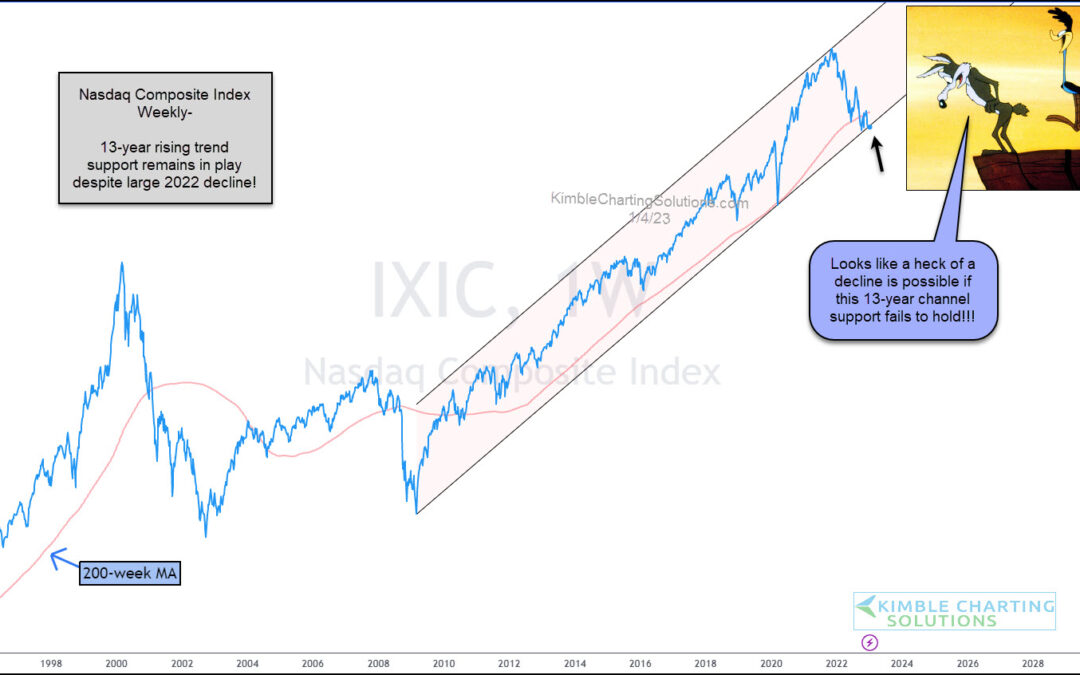
by Chris Kimble | Jan 5, 2023 | Kimble Charting
Despite a 33% decline in the Nasdaq, this key stock market index remains inside of this 13-year rising channel. Barely. Today’s long-term “weekly” chart of the Nasdaq Composite Index highlights just how tenuous the bull market is right now. And why investors need to...
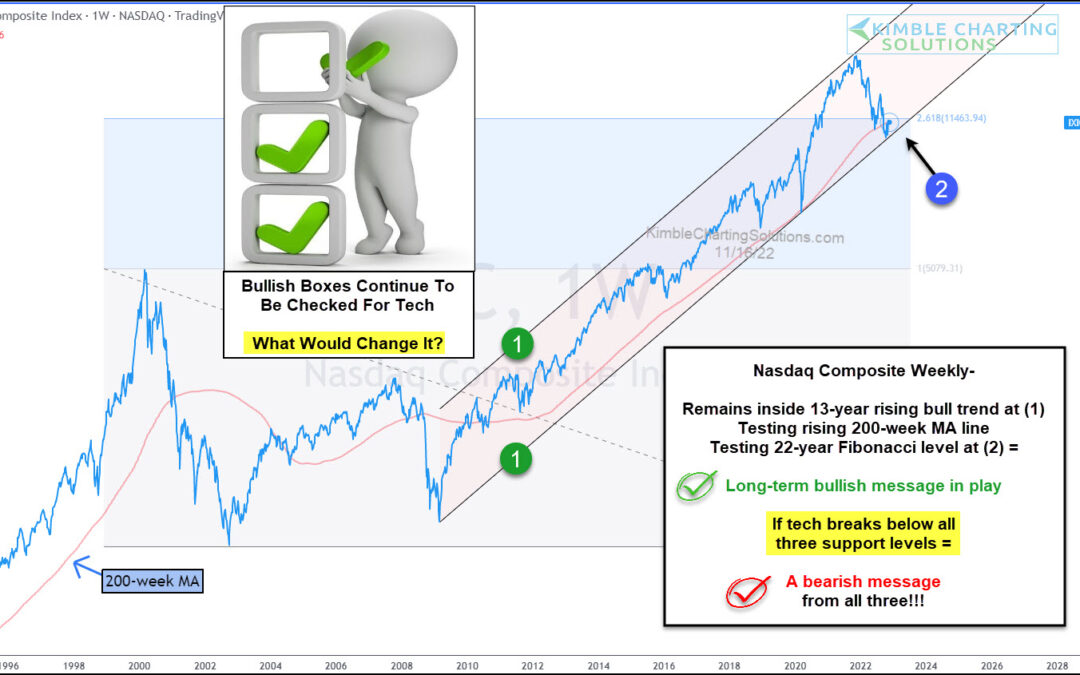
by Chris Kimble | Nov 17, 2022 | Kimble Charting
Tech stocks have had a dismal year in 2022 leading the stock market lower. But a broad gauge of the tech universe, the Nasdaq Composite, has reached a critical support area… and all investors would be wise to take notice. Above is a “weekly” chart of the Nasdaq. As...
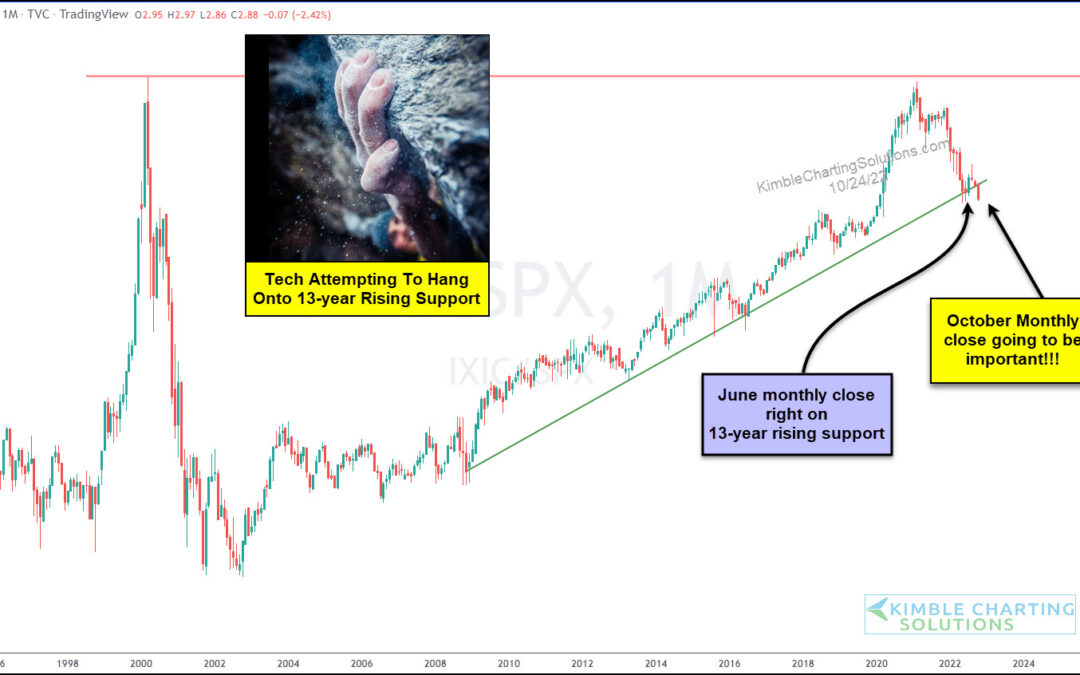
by Chris Kimble | Oct 25, 2022 | Kimble Charting
Several times we have highlighted the under-performance of tech stocks. However, now more than ever do tech stocks need to reverse their misfortune. Today, we look at a long-term “monthly” chart of the ratio of the Nasdaq Composite to the S&P 500 Index. As you can...
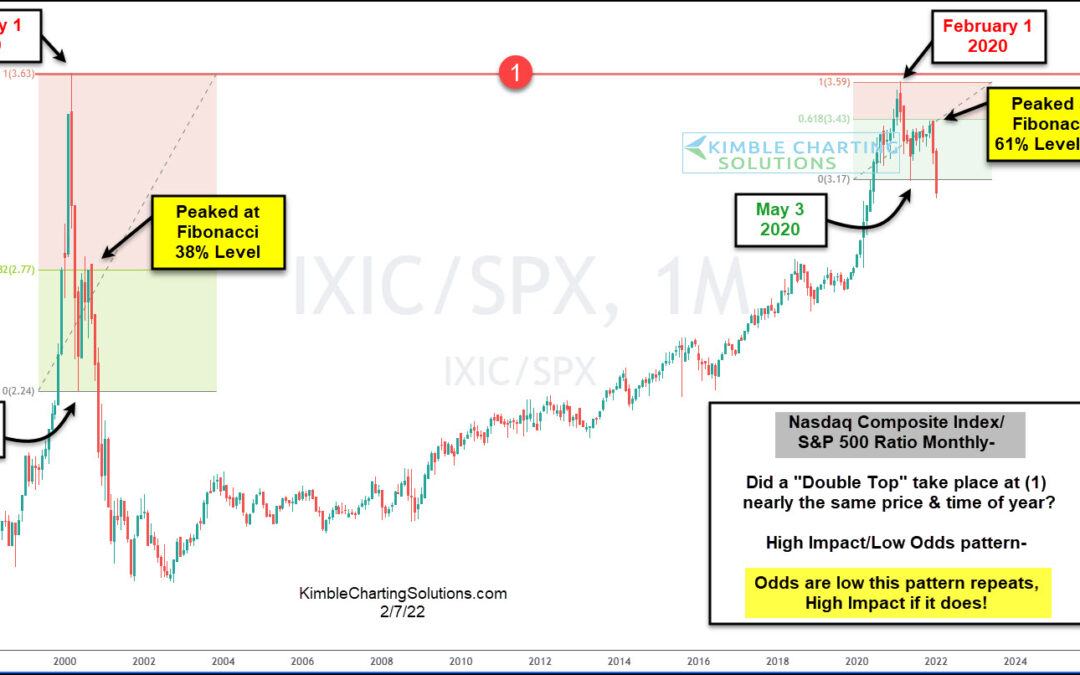
by Chris Kimble | Feb 7, 2022 | Kimble Charting
Tech stocks have gotten off to a poor start this year, as investors continued their buying strike against growth stocks. This is exemplified in today’s ratio chart, as we track the long-term price performance of the Nasdaq Composite versus the S&P 500 Index....
