by Chris Kimble | Sep 21, 2020 | Kimble Charting
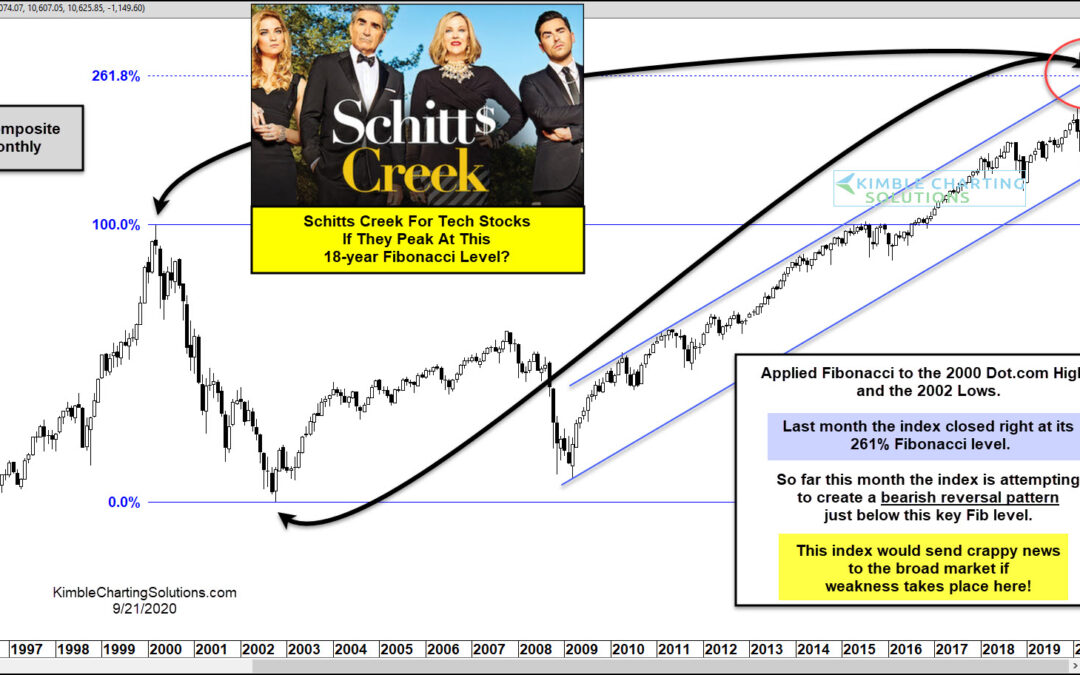
The Nasdaq has been the unparalleled leader of the stock market in 2020, having rallied furiously off the COVID-19 crash market bottom in March. But all of the excitement around tech stocks and the comeback in the stock market may be coming to an end… that is, if a...
by Chris Kimble | Feb 27, 2020 | Kimble Charting
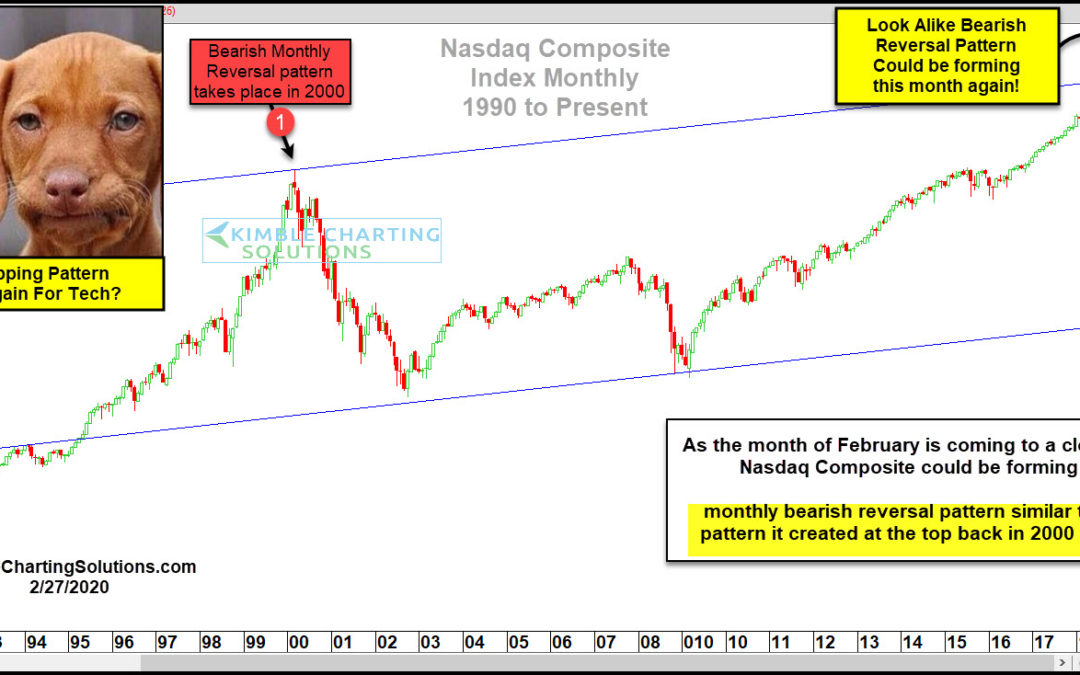
I am a fan of weekly charts over daily charts and monthly charts over weekly charts. As the month of February is nearing an end, the Nasdaq Composite could be creating a pattern that deserves a ton of attention! This chart looks at the Nasdaq Composite Index over the...
by Chris Kimble | Apr 12, 2019 | Kimble Charting
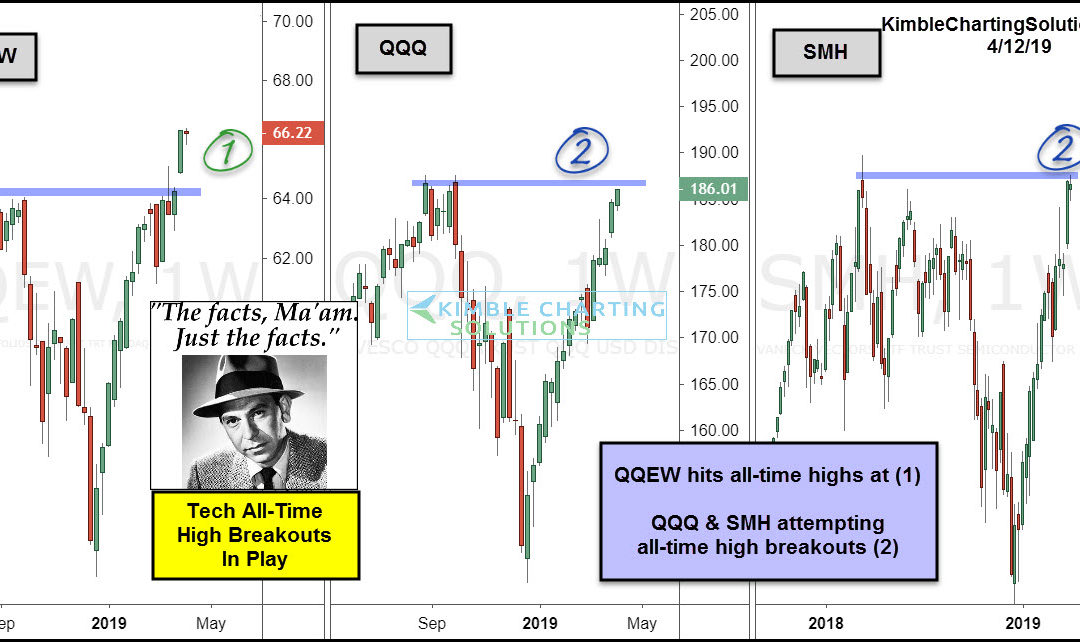
Is the Tech sector about to send an important bullish message to the broad market? It could today! This 3-pack looks at equal weight NDX 100 ETF (QQEW), the NDX 100 ETF (QQQ) and Semiconductor ETF (SMH) QQEW two weeks ago broke above last years highs, which puts it at...
by Chris Kimble | Aug 23, 2018 | Kimble Charting
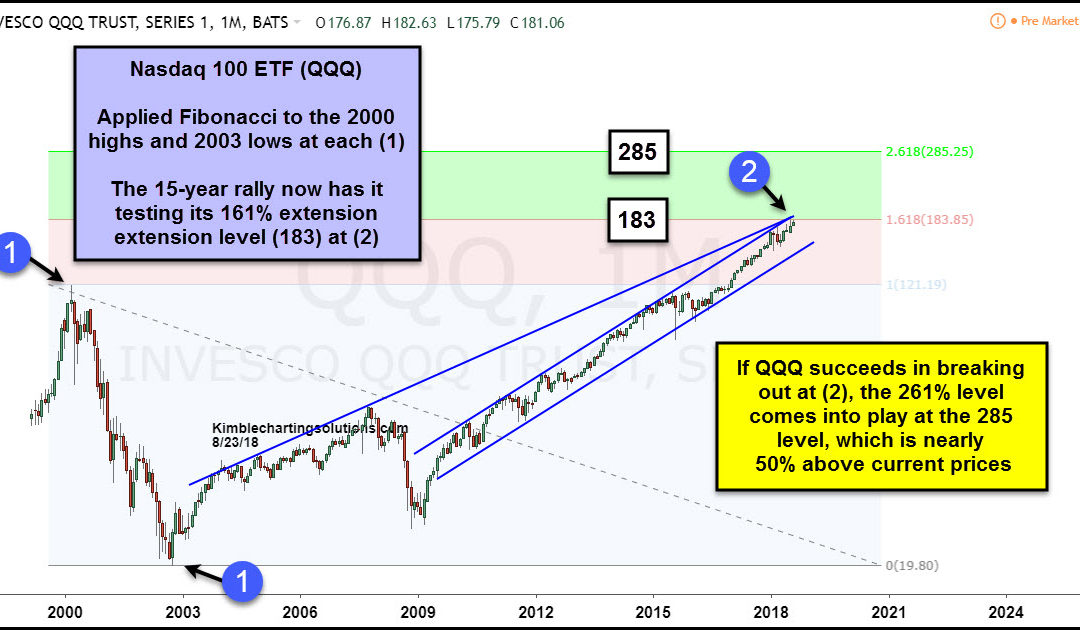
CLICK ON CHART TO ENLARGE This chart looks at the NDX100 ETF (QQQ) over the past 20-years on a monthly basis. Fibonacci was applied to the Dot.com highs in 2000 and the lows in 2003 at each (1). The rally over the past 15-years has QQQ testing it 161% extension level...
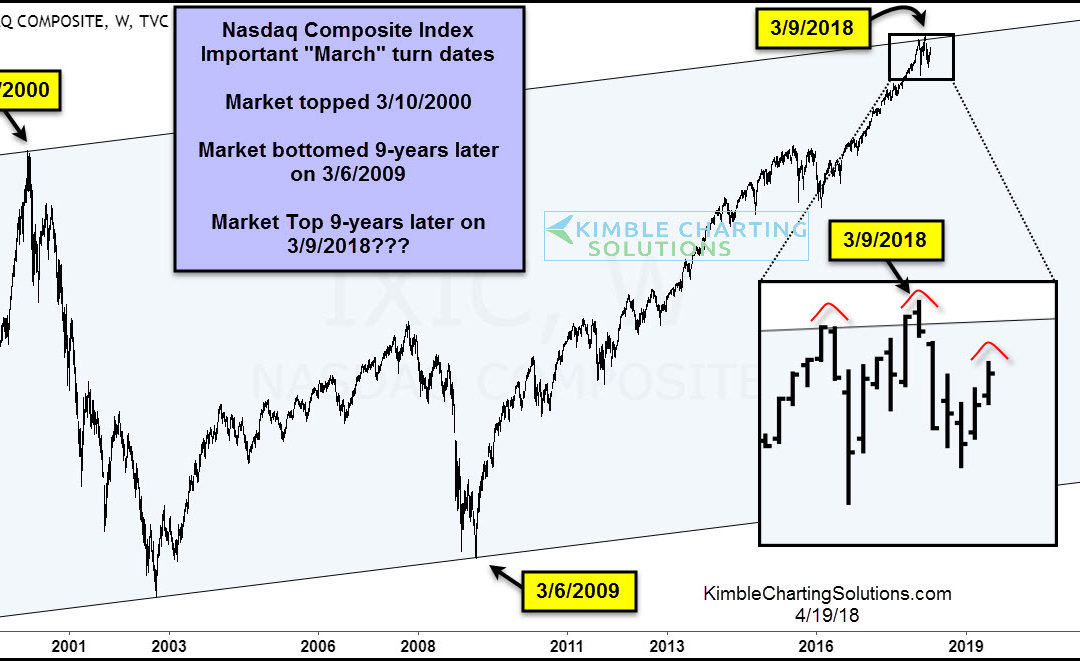
by Chris Kimble | Apr 20, 2018 | Kimble Charting
The month of March has produced some major turning points for the Nasdaq Composite over the last 20 years. The Nasdaq topped in March of 2000 and bottomed 9 years later in March 2009. Is it possible that 9 years after the major bottom, we put in a major top (March...
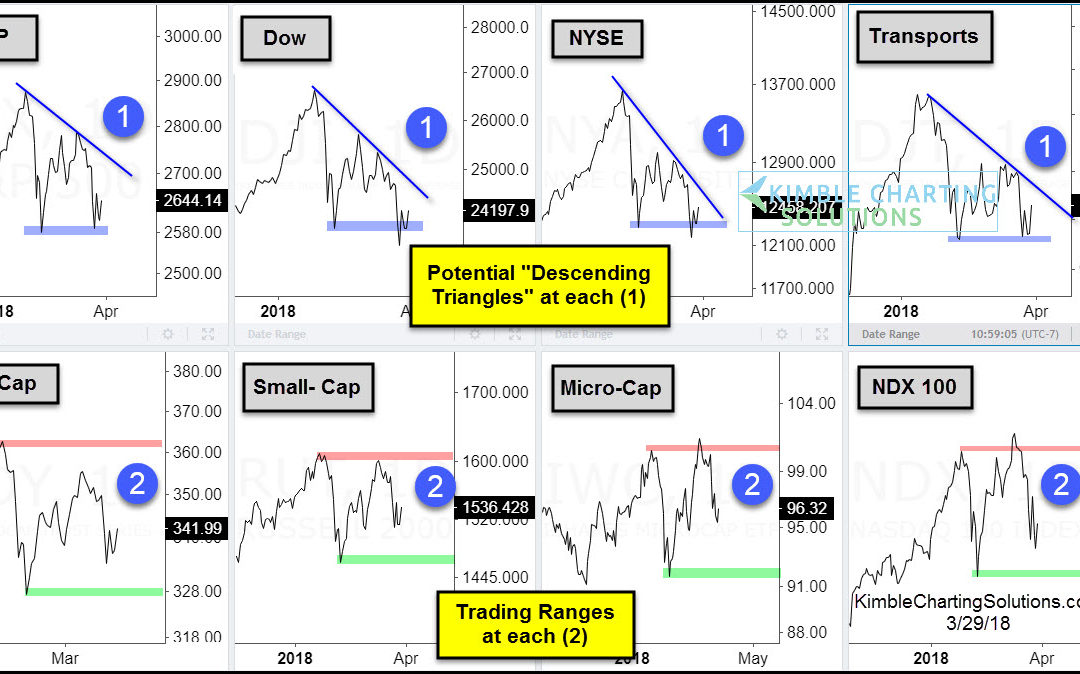
by Chris Kimble | Apr 2, 2018 | Kimble Charting
CLICK ON CHART TO ENLARGE The first part of the year got off to a great start, not so much as the first quarter of 2018 came to an end. The above 8-pack looks at numerous indices in the states and highlights the patterns created in the first quarter. First off, from a...
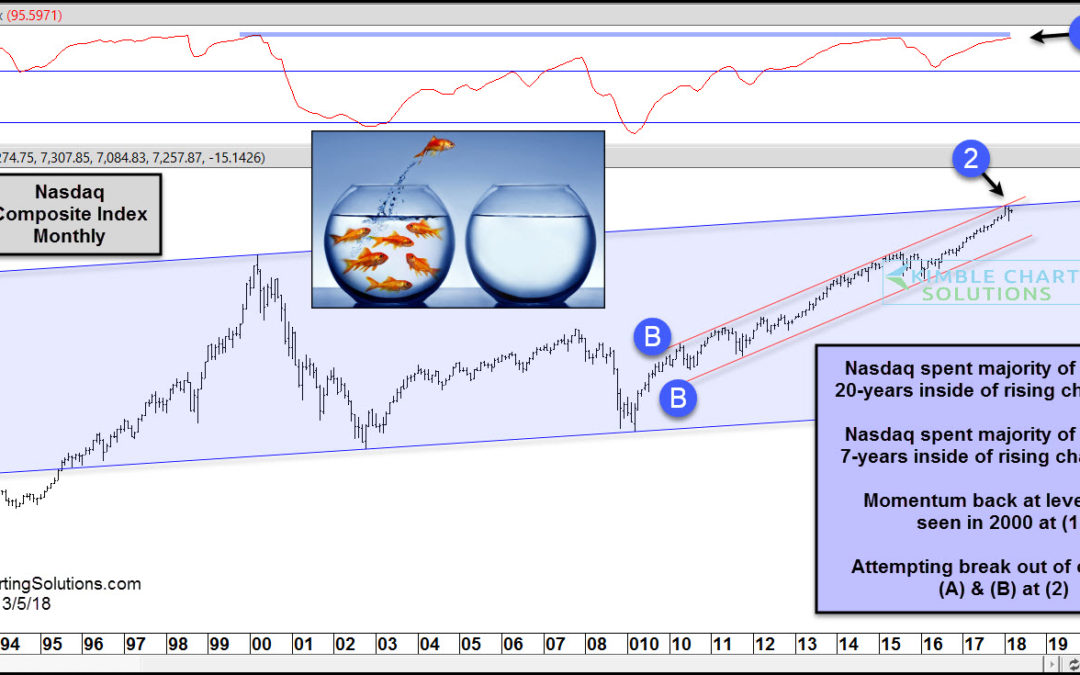
by Chris Kimble | Mar 5, 2018 | Kimble Charting
CLICK ON CHART TO ENLARGE The chart above looks at the Nasdaq Composite Index over the past 27-years, on a monthly basis. The trend remains solidly up for tech, no doubt about it! The index has spent the majority of the past 20-years inside of rising channel (A) and...
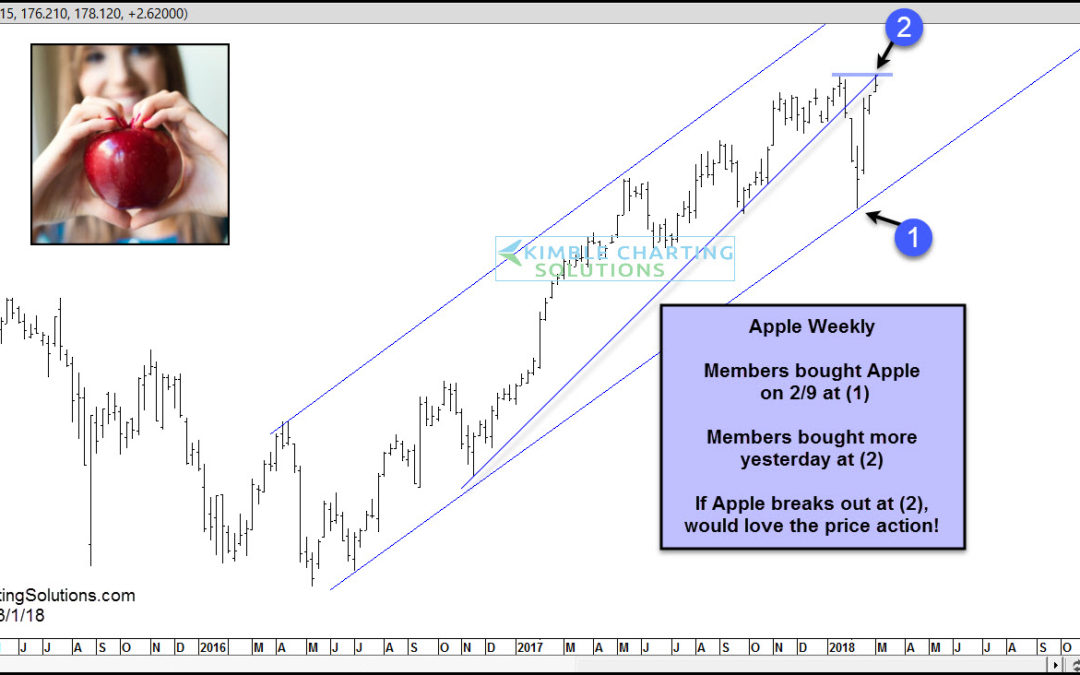
by Chris Kimble | Mar 1, 2018 | Kimble Charting
CLICK ON CHART TO ENLARGE The past 10-years in the month of March, Apple was up 80% of the time, with a median gain of over 7%. Apple is testing breakout levels this week at (2) above. Members bought Apple on 2/9 at (1) and bought some more with a tight stop just...
