by Chris Kimble | Jun 5, 2018 | Kimble Charting
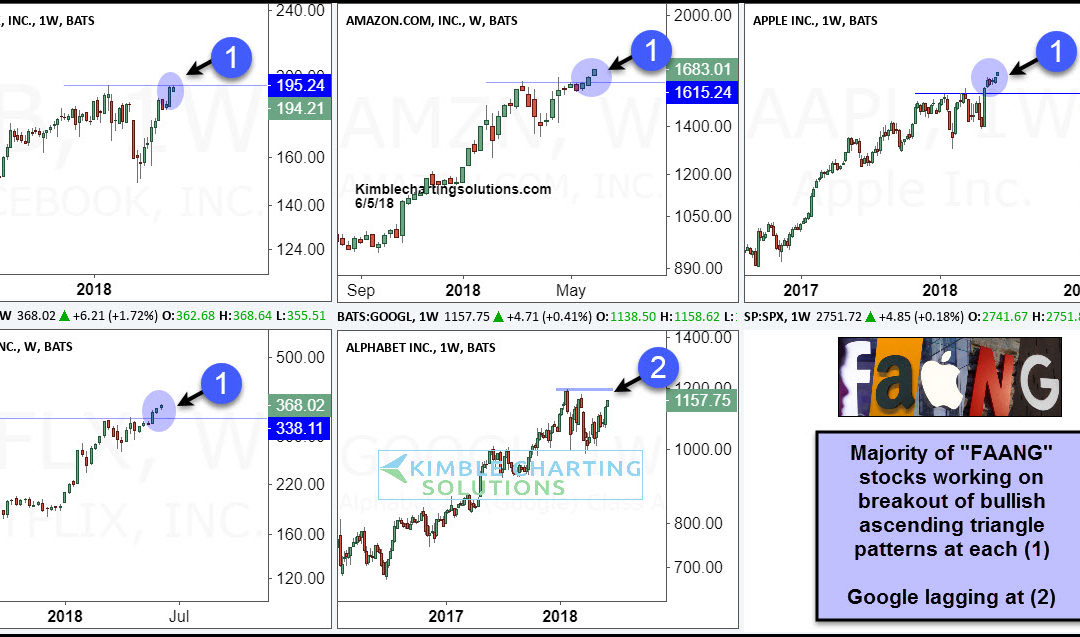
CLICK ON CHART TO ENLARGE The pack above looks at the “FAANG” stocks (Facebook, Amazon, Apple, Netflix & Google). The majority of them (FB, AMZN, AAPL, NFXL) are working on breakouts of old resistance, which could be the tops of bullish ascending...
by Chris Kimble | Mar 6, 2018 | Kimble Charting
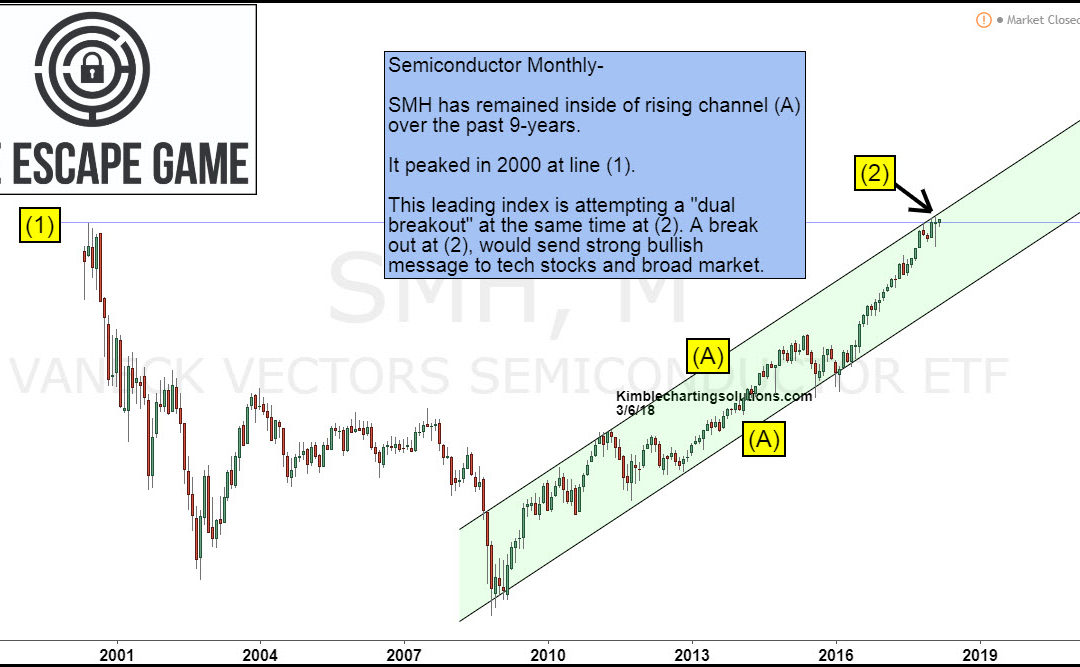
Since the 2009 lows, would you rather have owned Semiconductors (SMH) or the S&P 500? Since the 2009 lows, Semiconductors are up 550%, more than double the returns of the S&P. This very strong index is now making an attempt to “Escape” from where...
by Chris Kimble | Feb 5, 2018 | Kimble Charting
Last week the Power of the Pattern shared that most “FAANG stocks were testing the top of rising channels/breakout levels.” The one exception to that was Apple. Below looks at Apple over the past couple of years- CLICK ON CHART TO ENLARGE The trend of...
by Chris Kimble | Feb 1, 2018 | Kimble Charting
FAANG stocks (Facebook, Amazon, Apple, Netflix & Google) have done extremely well over the past couple of years and the trend all five remains higher. Below looks at each of these 5 stocks as well as the S&P 500 and the patterns they have created- CLICK ON...

by Chris Kimble | Apr 20, 2016 | Kimble Charting
CLICK ON CHART TO ENLARGE Netflix has been a stellar performer since the early 2000’s. It has remained inside of rising channel (A) for almost 15-years. Late last year, NFLX hit the top of rising channel resistance, where a strong rally almost stopped on a dime....

by Chris Kimble | Aug 14, 2015 | Kimble Charting
Let me start off with this…At this time the trend in the tech space is up! The Nasdaq Composite Index and Nasdaq 100 are both above support lines and long-term moving averages! Leading tech indices are at prices points where weakness would not be good to see...

by Chris Kimble | Mar 4, 2015 | Kimble Charting
CLICK ON CHART TO ENLARGE Netflix has spent the majority of the past year and a half, trading sideways, between the $320 to $470 range. As Frank says above….Would love to follow NFLX if it can muster up a breakout. Not too many feel it can accomplish this, as...
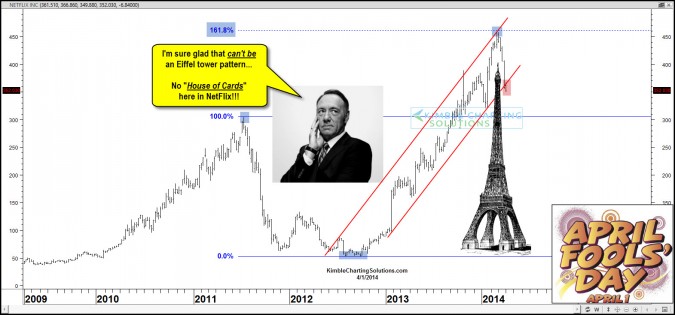
by Chris Kimble | Apr 1, 2014 | Kimble Charting
CLICK ON CHART TO ENLARGE I’m sure glad that over the past couple of years Netflix couldn’t have created an “Eiffel Tower” pattern and peaked at a Fibonacci extension level and is breaking a steep rising support line. I’m also glad...
